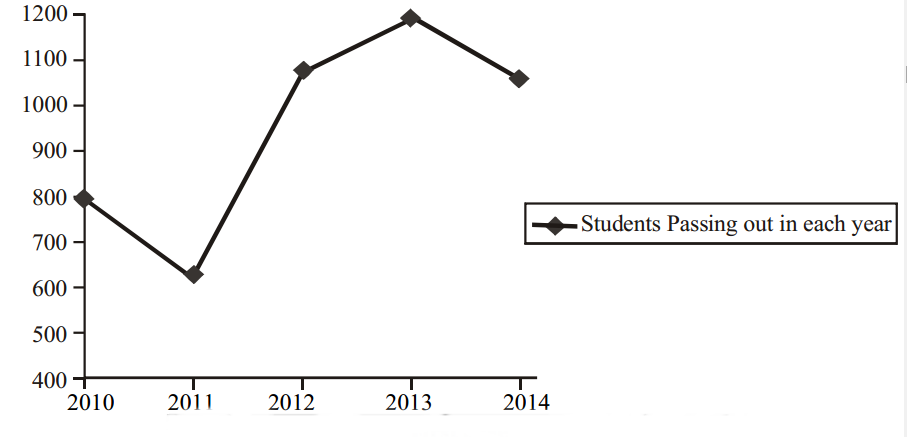
Hello and welcome to ExamPundit. Here is a set of Data Interpretation.
The first table gives the percentage of students in the
class of M.B.A who sought employment in the areas of Finance, Marketing and Software.
The second table gives the average starting salaries of the students per month,
in these areas.
class of M.B.A who sought employment in the areas of Finance, Marketing and Software.
The second table gives the average starting salaries of the students per month,
in these areas.
|
First Table
|
||||
|
|
Finance
|
Marketing
|
Software
|
Others
|
|
2010
|
22
|
36
|
19
|
23
|
|
2011
|
17
|
48
|
23
|
12
|
|
2012
|
23
|
43
|
21
|
13
|
|
2013
|
19
|
37
|
16
|
28
|
|
2014
|
32
|
32
|
20
|
16
|
|
Second Table
|
|||
|
|
Finance
|
Marketing
|
Software
|
|
2010
|
5450
|
5170
|
5290
|
|
2011
|
6380
|
6390
|
6440
|
|
2012
|
7550
|
7630
|
7050
|
|
2013
|
8920
|
8960
|
7760
|
|
2014
|
9810
|
10220
|
8640
|
1. The number of
students who got jobs in finance is less than the number of students getting
marketing jobs, in the five years,
by
(a) 826
(b) 650
(c) 750
(d) 548
(e) None of these
2. In 2012, students
seeking jobs in finance earned Rs ____________ more than those opting for software (in lakhs)
seeking jobs in finance earned Rs ____________ more than those opting for software (in lakhs)
(a) 43
(b) 33.8
(c) 28.4
(d) 38.8
(e) None of these
3. What is the
percent increase in the average salary of Finance from 2010 to 2014?
percent increase in the average salary of Finance from 2010 to 2014?
(a) 60
(b) 32
(c) 96
(d) 80
(e) None of these
4. What is the average
monthly salary offered to a management graduate in the year 2011?
monthly salary offered to a management graduate in the year 2011?
(a) 6403
(b) 6330
(c) 6333
(d) Can’t be determined
(e) None of these
5. The average annual
rate at which the initial salary offered in Software, increases
rate at which the initial salary offered in Software, increases
(a) 21%
(b) 33%
(c) 15.9%
(d) 65%
(e) None of these
Regards
Team ExamPundit
Sponsored
(adsbygoogle = window.adsbygoogle || []).push({});
Books For 2015 Banking/Insurance Exams


