Hello and welcome to ExamPundit. Here is a Data Interpretation quiz of Moderate level.
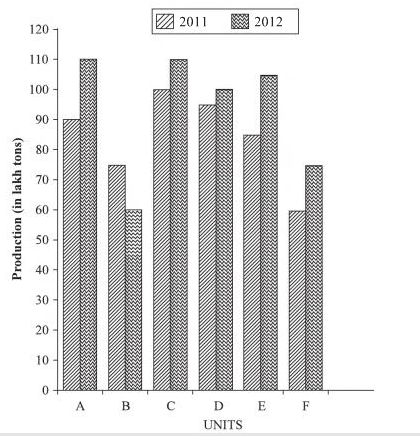
Study the following
graph carefully and answer the below questions.
graph carefully and answer the below questions.
Production (in Lakh
Tons) of six units of company during 2011 and 2012
Tons) of six units of company during 2011 and 2012
1. What is the
average production of all the units (in lakh tons) for the year 2012?
average production of all the units (in lakh tons) for the year 2012?
(a) 89
(b) 92
(c) 87
(d) 95
(e) None of the above
2. Average production
of three units A, B and C in 2011 is what per cent of the average production of
units D, E and F in 2012? (Round off to
two digits after decimal)
of three units A, B and C in 2011 is what per cent of the average production of
units D, E and F in 2012? (Round off to
two digits after decimal)
(a) 109.43
(b) 90.37
(c) 91.38
(d) 106.43
(e) None of them
3. What is the ratio
of total production for two years together for Unit B to that for C?
of total production for two years together for Unit B to that for C?
(a) 17 : 13
(b) 13 : 17
(c) 11 : 13
(d) 19 : 13
(e) None of them
4. Total production
for two years together by Unit F is what per cent of the total production of
the two years together by Unit
D?(round off to two digits after decimal)
for two years together by Unit F is what per cent of the total production of
the two years together by Unit
D?(round off to two digits after decimal)
(a) 79.49
(b) 78.49
(c) 78.47
(d) 79.29
(e) None of the above
5. What is the total
production of units C, D and E together for both the years? (In lakh tons)
production of units C, D and E together for both the years? (In lakh tons)
(a) 495
(b) 595
(c) 545
(d) 515
(e) None of these
Regards
Team ExamPundit
Sponsored
(adsbygoogle = window.adsbygoogle || []).push({});
Books For 2015 Banking/Insurance Exams