Hello and welcome to exampundit. Today we are sharing an Data Interpretation Quiz for Bank PO Prelims Exam.
Data Interpretation is one of the most important topic of IBPS PO, IBPS Clerk, SBI PO & Clerk exams. We have explained already How to prepare Data Interpretation for Bank Exams. Today we are sharing 2 DIs, One is on Bar Graph and second is based on Pie Chart + Linear Graph + Bar Graph.
The following set consists 10 questions on Data Interpretation Questions with 10 minutes in hand.
[WpProQuiz 249]
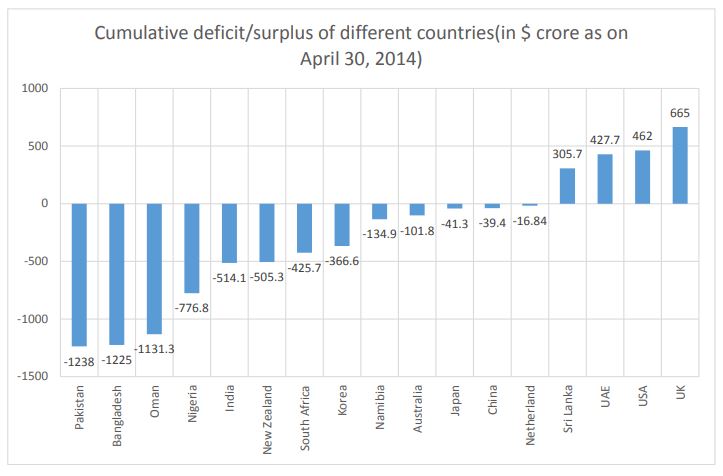 The total of the first three deficit countries (in $ million) = $3594.3. The total of the next five deficit countries (in $ million) = $2588.5. The total of the last five deficit countries (in $ million) - $334.2. The total of the four surplus countries (in $ million) = $1860.4
Q1. The country whose surplus is nearly equal to the average of the 4 surplus countries is
(1) Sri Lanka
(2) UAE
(3) USA
(4) UK
(5) None of these
[su_spoiler title="Answer & Solution"]Option: 3
Solution: Total of four surplus = 1860.4 Average of four surplus = 1860.4/4 = 465.1 (near to surplus of USA)
[/su_spoiler]
Q2. The ratio of the deficit of the last five deficit countries to the overall deficit of all the deficit countries is nearly equal to
(1) 0.513:1
(2) 0.0513:1
(3) 0.712:1
(4) 0.0712:1
(5) None of these
[su_spoiler title="Answer & Solution"]Option: 2
Solution: Total deficit of last five countries = 334.2 Overall deficit of all the deficit countries = 3594.3 + 2588.5 + 334.2 = 6517 Required ratio = 334.2:6517 = 0.0513
[/su_spoiler]
Q3. The average of the total deficit of the middle five deficit countries is nearly the deficit of which country?
(1) India
(2) New Zealand
(3) Nigeria
(4) South Africa
(5) None of these
[su_spoiler title="Answer & Solution"]Option: 1
Solution: Total of middle five deficit countries = 2588.5 Average of middle five deficit countries = 2588.5/5 = 517.7 (near to deficit of India)
[/su_spoiler]
Q4. The ratio of net deficit to net surplus is equal to
(1) 6517:2588.5
(2) 6517:1860.4
(3) 6571:3594.3
(4) Can’t be determined
(5) None of these
[su_spoiler title="Answer & Solution"]Option: 2
Solution: Net deficit = 6517 Net surplus = 1860.4 Required ratio = 6517:1860.4
[/su_spoiler]
Q5. The ratio of the difference between the highest and the lowest of the surplus countries to the difference between the deficit of Bangladesh and Oman is
(1) 3539:1225
(2) 3593:937
(3) 3359:1131
(4) 3593:397
(5) None of these
[su_spoiler title="Answer & Solution"]Option: 2
Solution: Difference between the highest and the lowest of the surplus countries = 665 – 305.7 = 359.3 Difference between the deficit of Bangladesh and Oman = 1225 – 1131.3 = 93.7 Required ratio = 3593:937
[/su_spoiler]
The total of the first three deficit countries (in $ million) = $3594.3. The total of the next five deficit countries (in $ million) = $2588.5. The total of the last five deficit countries (in $ million) - $334.2. The total of the four surplus countries (in $ million) = $1860.4
Q1. The country whose surplus is nearly equal to the average of the 4 surplus countries is
(1) Sri Lanka
(2) UAE
(3) USA
(4) UK
(5) None of these
[su_spoiler title="Answer & Solution"]Option: 3
Solution: Total of four surplus = 1860.4 Average of four surplus = 1860.4/4 = 465.1 (near to surplus of USA)
[/su_spoiler]
Q2. The ratio of the deficit of the last five deficit countries to the overall deficit of all the deficit countries is nearly equal to
(1) 0.513:1
(2) 0.0513:1
(3) 0.712:1
(4) 0.0712:1
(5) None of these
[su_spoiler title="Answer & Solution"]Option: 2
Solution: Total deficit of last five countries = 334.2 Overall deficit of all the deficit countries = 3594.3 + 2588.5 + 334.2 = 6517 Required ratio = 334.2:6517 = 0.0513
[/su_spoiler]
Q3. The average of the total deficit of the middle five deficit countries is nearly the deficit of which country?
(1) India
(2) New Zealand
(3) Nigeria
(4) South Africa
(5) None of these
[su_spoiler title="Answer & Solution"]Option: 1
Solution: Total of middle five deficit countries = 2588.5 Average of middle five deficit countries = 2588.5/5 = 517.7 (near to deficit of India)
[/su_spoiler]
Q4. The ratio of net deficit to net surplus is equal to
(1) 6517:2588.5
(2) 6517:1860.4
(3) 6571:3594.3
(4) Can’t be determined
(5) None of these
[su_spoiler title="Answer & Solution"]Option: 2
Solution: Net deficit = 6517 Net surplus = 1860.4 Required ratio = 6517:1860.4
[/su_spoiler]
Q5. The ratio of the difference between the highest and the lowest of the surplus countries to the difference between the deficit of Bangladesh and Oman is
(1) 3539:1225
(2) 3593:937
(3) 3359:1131
(4) 3593:397
(5) None of these
[su_spoiler title="Answer & Solution"]Option: 2
Solution: Difference between the highest and the lowest of the surplus countries = 665 – 305.7 = 359.3 Difference between the deficit of Bangladesh and Oman = 1225 – 1131.3 = 93.7 Required ratio = 3593:937
[/su_spoiler]


[su_button url="https://goo.gl/SeBSPi" target="blank" style="flat" background="#005c8c" color="#ffffff" size="5" center="yes" icon="icon: bolt" icon_color="#ffffff" text_shadow="0px 0px 0px #000000"]Click here to Take Free Mock[/su_button]
Data Interpretation Quiz for Bank Exams
Study the following bar chart carefully and answer the given questions:
The total of the first three deficit countries (in $ million) = $3594.3. The total of the next five deficit countries (in $ million) = $2588.5. The total of the last five deficit countries (in $ million) - $334.2. The total of the four surplus countries (in $ million) = $1860.4
Q1. The country whose surplus is nearly equal to the average of the 4 surplus countries is
(1) Sri Lanka
(2) UAE
(3) USA
(4) UK
(5) None of these
[su_spoiler title="Answer & Solution"]Option: 3
Solution: Total of four surplus = 1860.4 Average of four surplus = 1860.4/4 = 465.1 (near to surplus of USA)
[/su_spoiler]
Q2. The ratio of the deficit of the last five deficit countries to the overall deficit of all the deficit countries is nearly equal to
(1) 0.513:1
(2) 0.0513:1
(3) 0.712:1
(4) 0.0712:1
(5) None of these
[su_spoiler title="Answer & Solution"]Option: 2
Solution: Total deficit of last five countries = 334.2 Overall deficit of all the deficit countries = 3594.3 + 2588.5 + 334.2 = 6517 Required ratio = 334.2:6517 = 0.0513
[/su_spoiler]
Q3. The average of the total deficit of the middle five deficit countries is nearly the deficit of which country?
(1) India
(2) New Zealand
(3) Nigeria
(4) South Africa
(5) None of these
[su_spoiler title="Answer & Solution"]Option: 1
Solution: Total of middle five deficit countries = 2588.5 Average of middle five deficit countries = 2588.5/5 = 517.7 (near to deficit of India)
[/su_spoiler]
Q4. The ratio of net deficit to net surplus is equal to
(1) 6517:2588.5
(2) 6517:1860.4
(3) 6571:3594.3
(4) Can’t be determined
(5) None of these
[su_spoiler title="Answer & Solution"]Option: 2
Solution: Net deficit = 6517 Net surplus = 1860.4 Required ratio = 6517:1860.4
[/su_spoiler]
Q5. The ratio of the difference between the highest and the lowest of the surplus countries to the difference between the deficit of Bangladesh and Oman is
(1) 3539:1225
(2) 3593:937
(3) 3359:1131
(4) 3593:397
(5) None of these
[su_spoiler title="Answer & Solution"]Option: 2
Solution: Difference between the highest and the lowest of the surplus countries = 665 – 305.7 = 359.3 Difference between the deficit of Bangladesh and Oman = 1225 – 1131.3 = 93.7 Required ratio = 3593:937
[/su_spoiler]
Refer to the following figures.
World coffee products
Total coffee exports in 2012-13 = 62.9 million bags 1 Bag – 60kg Average price of coffee in X-Y years = (Price in X + Price in Y)/2
Q6. How many million kilograms of coffee was exported by Brazil in 2012-13? (1) 775 (2) 755 (3) 535 (4) 345 (5) None of these [su_spoiler title="Answer & Solution"]Option: 2 Solution: Total coffee exports = 62.9 million bags x 60 kg per bag =3774 million kg Amount of coffee exported by Brazil = (20/100) x 3774 = 755 million kg [/su_spoiler] Q7. Coffee prices showed the greatest increase between (1) 2010-11 (2) 2011-12 (3) 2012-13 (4) 2013-14 (5) None of these [su_spoiler title="Answer & Solution"]Option: 1 Solution: For identifying the greatest increase on a Cartesian graph find out the period where the slope of the curve is the steepest. Hence, the coffee prices showed the greatest increase between 2010 and 2011 [/su_spoiler] Q8. In 2012-13, what was Uganda’s earning approximately by way of coffee exports? (1) $170 million (2) $150 million (3) $190 million (4) $200 million (5) None of these [su_spoiler title="Answer & Solution"]Option: 1 Solution: Correlate the Cartesian graph with pie chart Average price of coffee in 2012-13 = (160 + 140) /2 = 150 cents per kg Uganda’s earnings through coffee export = (3/100) x 3774 x 150 = 16983 or 170000 or $170 million [/su_spoiler] Q9. Find the value of coffee stocks with producers in 2008-09? (1) $2000 million (2) $3000 million (3) $1815 million (4) $1518 million (5) None of these [su_spoiler title="Answer & Solution"]Option: 3 Solution: Correlate the Cartesian graph with the bar graphs which gives the producer stock Average price of coffee per kg in 2008-09 = (50 + 60)/2 55 cents = $0.55 Value of coffee stocks with producers in 2008-09 = Stock x Price = Number of bags x Amount of coffee x Average price prevailing in 2008-09 = 55 x 60 x 0.55 = 1815 million US $ [/su_spoiler] Q10. During which period was the value of coffee with producers highest? (1) 2010-11 (2) 2011-12 (3) 2012-13 (4) 2013-14 (5) None of these [su_spoiler title="Answer & Solution"]Option: 2 Solution: One might be misled by the quantity of stocks held. But the question deals with the value of stocks so held. It is easy to see that the prices of coffee were at the peak in 2011-12. The highest value of stock has necessarily to be in the year 2011-12 [/su_spoiler] Let us know in the comment section if you have liked our quiz. Your comments are extremely motivating for us. Also, do share the quizzes with your Friends and co-aspirants. All the best. Regards Team Exampundit