Hello and welcome to ExamPundit. Here is a set of Data Interpretation Quiz.
Regards
function answer(id){ if(document.getElementById(id).style.display == "block"){ document.getElementById(id).style.display = "none"; }else{ document.getElementById(id).style.display = "block"; } } #a1{display:none;} #a2{display:none;} #a3{display:none;} #a4{display:none;} #a5{display:none;}
Team ExamPundit
Sponsored
(adsbygoogle = window.adsbygoogle || []).push({});
Books For 2015 Banking/Insurance Exams

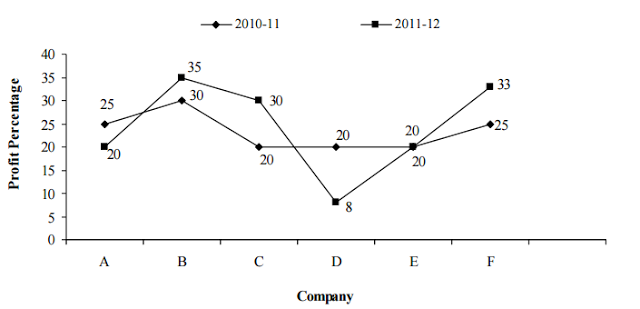
Study the graph and
answer the questions that follow:

Profit percentage of
six companies in two successive years
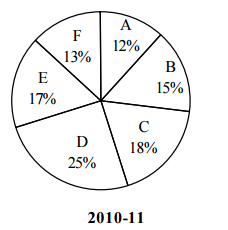
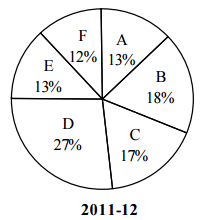
The pie-chart show
the proportion of Income of companies. during two successive years
Total Income 750 Crore
Total Income 800 Crore
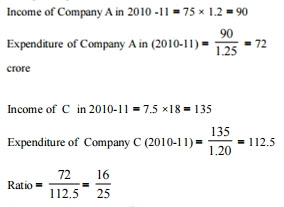
1. What is the ratio
of the expenditure of Company A to that of Company C in 2010-11?
(a) 4 : 5
(b) 5 : 4
(c) 16 : 25
(d) 25 : 16
(e) None of these
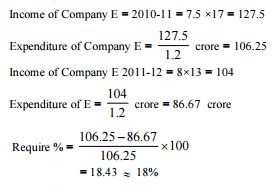
2. What is the
approximate percentage increase/decrease in expenditure made by Company E in
2011-12 with respect to its previous year?
(a) 12%
(b) 14%
(c) 27%
(d) 18%
(e) None of these
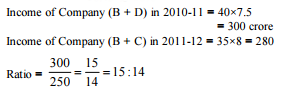
3. Find out the ratio
of income of Company B and D together in the year 2010-11 to that of Company B
and C in 2011-12.
(a) 7 : 6
(b) 6 : 7
(c) 14 : 15
(d) 15 : 14
(e) None of these
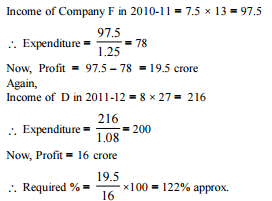
4. The profit of the
Company F in 2010-11 is approximately what per cent of profit of Company D in
the year 2011-12?
(a) 125%
(b) 90%
(c) 122%
(e) 130%
(e) None of these
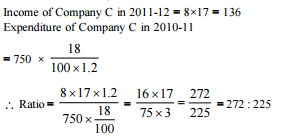
5. What is the ratio
of income of Company C in 2011-12 to expenditure of Company C in 2010-11?
(a) 30 : 23
(b) 272 : 225
(c) 4 : 5
(d) 5 : 3
(e) Can't be determined
Regards
function answer(id){ if(document.getElementById(id).style.display == "block"){ document.getElementById(id).style.display = "none"; }else{ document.getElementById(id).style.display = "block"; } } #a1{display:none;} #a2{display:none;} #a3{display:none;} #a4{display:none;} #a5{display:none;}
Team ExamPundit
Sponsored
(adsbygoogle = window.adsbygoogle || []).push({});
Books For 2015 Banking/Insurance Exams