Hello and welcome to exampundit. Here is a set of Quantitative Aptitude Quiz for Upcoming IBPS Exams.
Direction (Q. 1-5):
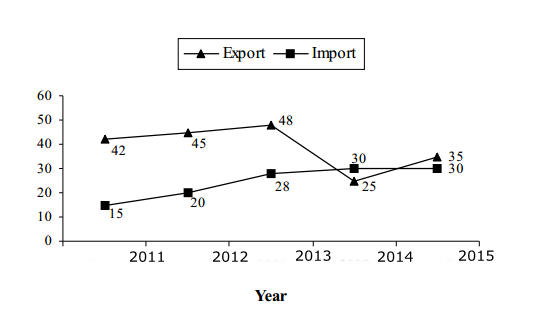
The following graph shows the export and Import (in lacs) of Company P through 2011-15:
Ratio of Export and Import of Company P and Q (P : Q) through these years is as follows:
|
Year
|
Export(P:Q)
|
Import(P:Q)
|
|
2011
|
3:5
|
3:7
|
|
2012
|
3:4
|
4:9
|
|
2013
|
4:7
|
7:10
|
|
2014
|
5:8
|
6:5
|
|
2015
|
7:9
|
3:8
|
1. Export of ‘Q’ in 2011. Is how much percentage more or less than export of P in 2011?
(a) 60.34%
(b) 64.66%
(c) 66.66%
(d) 67.85%
(e) 70%
2. Average import of ‘Q’ is how much percentage more or less than average export of ‘Q’?
(a) 26.9% more
(b) 34.2% less
(c) 24.7% less
(d) 22.7% more
(e) Both are equal
3. What is the difference between total import of company Q and total export of Company P?
(a) 32 units
(b) 30 units
(c) 28 units
(d) 40 units
(e) 25 units
4. What is the difference between export of Q in 2014 and import of P in 2013?
(a) 10 units
(b) 11 units
(c) 12 units
(d) 13 units
(e) 9 units
5. Import of Q in 2013 is how much percentage more or less then the export of ‘P’ in 2014?
(a) 50%
(b) 40%
(c) 70%
(d) 65%
(e) 60%
Sponsored
(adsbygoogle = window.adsbygoogle || []).push({});
Solutions:
|
Year
|
Export
|
Import
|
|
2011
|
70
|
35
|
|
2012
|
60
|
45
|
|
2013
|
84
|
40
|
|
2014
|
40
|
25
|
|
2015
|
45
|
80
|
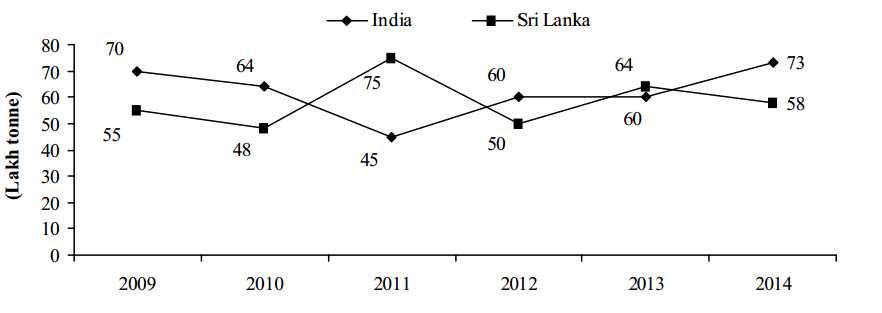
Following line graph shows Sugar Cane produced by India and Sri Lanka during the period of 2009–2014.
6. What is the percentage decrease in production from 2009–2010 for India?
(a) 6%
(b) 8 4/7%
(c) 1 4/7%
(d) 9%
(e) None of these
7. What is the average production of Sri Lanka from 2009 to 2012?
(a) 67
(b) 64
(c) 63
(d) 59
(e) 57
8. What is the ratio of the maximum production to average production for India?
(a) 73 : 57
(b) 73 : 59
(c) 73 : 62
(d) 73 : 64
(e) None of these
9. What is the difference of total production of these two countries during 2009–2014?
(a) 18
(b) 20
(c) 22
(d) 24
(e) 26
10. For Sri Lanka during which period its production increases maximum from the previous year?
(a) 2009–2010
(b) 2010–2011
(c) 2011–2012
(d) 2012–2013
(e) 2013–2014
Solutions:
1. Reqd % = 70-64/70 x 100 = 60/7
So, 8 4/7%
2. You know how to calculate average.
3. Take the highest i.e. 73 and take the rest including highest and average them = 73:62
4. Simple Subtract
EP Recommends: Toprankers Mock Tests
- NABARD Grade A & B 2017 – Free Mock Test
- IBPS PO & Clerk 2017 – Free Mock Test
- IBPS RRB Officer 2017 – Free Mock Test
- SSC CGL Tier I & Tier II 2017 – Free Mock Test
- SSC Stenographer 2017 – Free Mock Test
EP Recommends: Oliveboard Mock Tests
Sponsored
(adsbygoogle = window.adsbygoogle || []).push({});
Regards
Team ExamPundit


