Hello and welcome to ExamPundit. This was posted previously, now we are reposting for people who have asked for it since it appeared in the NABARD Assistant Manager.
Directions 1 – 3:
Answer the questions on the basis
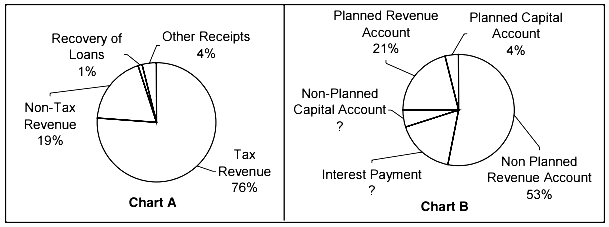
of the information given below. The break-up of the financial budget of a
country called Chaupatland for FY 2010-11 is represented by the pie charts
given below. Pie chart A represents Budgeted Revenue and pie chart B represents
Budgeted Expenditure.
of the information given below. The break-up of the financial budget of a
country called Chaupatland for FY 2010-11 is represented by the pie charts
given below. Pie chart A represents Budgeted Revenue and pie chart B represents
Budgeted Expenditure.
Budgeted Revenue was less than
Budgeted Expenditure by Rs. 625 thousand crores. Interest Payment exceeded
Non-Planned Capital Account by 12% of Budgeted Expenditure. Non-Tax Revenue was
Rs. 285 thousand crores less than Tax Revenue.
Budgeted Expenditure by Rs. 625 thousand crores. Interest Payment exceeded
Non-Planned Capital Account by 12% of Budgeted Expenditure. Non-Tax Revenue was
Rs. 285 thousand crores less than Tax Revenue.
1. The difference
between Budgeted Expenditure and Budgeted Revenue was what percentage of Budgeted Revenue?
between Budgeted Expenditure and Budgeted Revenue was what percentage of Budgeted Revenue?
(a) 120%
(b) 125%
(c) 25%
(d) 20%
(e) None of these
| Solutions – The difference between Budgeted Expenditure and Budgeted Revenue when expressed as a percentage of Budgeted Revenue 625/500 × 100 = 125% |
|---|
2. By how much did
the sum of Planned Revenue Account and Planned Capital Account exceed Non-Tax
Revenue?
the sum of Planned Revenue Account and Planned Capital Account exceed Non-Tax
Revenue?
(a) Rs. 281.25 thousand crores
(b) Rs. 236.25 thousand crores
(c) Rs. 186.25 thousand crores
(d) Rs. 88.25 thousand crores
(e) None of these
| Solutions – The sum of Planned Revenue Account and Planned Capital Account (Rs. 281.25 thousand crores) exceeded the Non-Tax Revenue (Rs. 95 thousand crores) by Rs. 186.25 thousand crores. |
|---|
3. In FY 2011-12, if
Budgeted Revenue is increased by 52% over that of the previous year, then what will
be the new percentage share of Tax
Revenue in Budgeted Revenue?
Budgeted Revenue is increased by 52% over that of the previous year, then what will
be the new percentage share of Tax
Revenue in Budgeted Revenue?
(a) 50%
(b) 76%
(c) 56%
(d) Cannot be determined
(e) None of these
| Solutions – Since nothing is mentioned about the break-up of Budgeted Revenue in FY 2011-12, the percentage share of Tax Revenue cannot be determined. |
|---|
| Solutions – Let Interest Payment be x% and Non-Planned Capital Account be y% of Budgeted Expenditure. From pie chart B, x + y = 22% and x – y = 12%. Thus, x = 17 and y = 5. Now 76% – 19% i.e. 57% of Budgeted Revenue is given as Rs. 285 thousand crores. Thus Budgeted Revenue = Rs. 500 thousand crores. Budgeted Expenditure = Budgeted Revenue + Rs. 625 thousand crores = Rs. 1125 thousand crores. |
|---|
Directions for
questions 4 and 5: Answer the questions on the basis of the information given
below.
questions 4 and 5: Answer the questions on the basis of the information given
below.
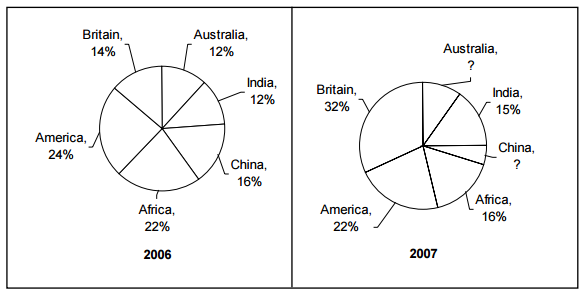
A traveler spent some money in
six different nations. The pie charts given below show the money spent in each
of the nations as a percentage of the total money spent in that year. The money
spent in China in the year 2007 was 75% less than the money spent in China in
the year 2006. The money spent in India was same for the two years.
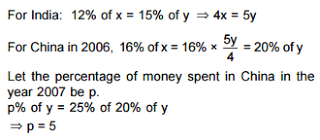
4. In the year 2007,
what percentage of the total money spent by the traveler was spent in China?
what percentage of the total money spent by the traveler was spent in China?
(a) 8%
(b) 6%
(c) 4%
(d) 5%
(e) None of these
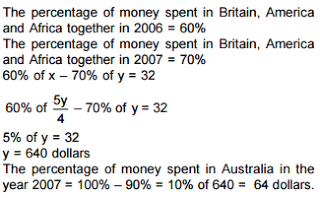
5. If the money spent
by the traveler in Britain, America and Africa together was 32 dollars more in 2006
than in 2007, then how much money (in
dollars) was spent by the traveler in Australia in the year 2007?
by the traveler in Britain, America and Africa together was 32 dollars more in 2006
than in 2007, then how much money (in
dollars) was spent by the traveler in Australia in the year 2007?
(a) 64
(b) 120
(c) 96
(d) 80
(e) None of these
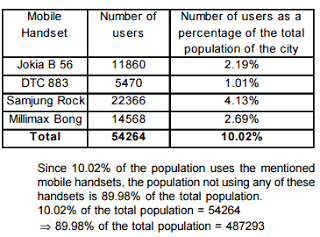
6. The table given below shows partial information about the
number of users of various mobile handsets in the city of Tringpur, where
nobody uses more than one handset.
number of users of various mobile handsets in the city of Tringpur, where
nobody uses more than one handset.
What is the total
number of people (approximately) in Tringpur who do not use any of the above
mentioned handsets?
number of people (approximately) in Tringpur who do not use any of the above
mentioned handsets?
(a) 546200
(b) 487300
(c) 398900
(d) 426500
(e) None of these
Regards
function answer(id){
if(document.getElementById(id).style.display == “block”){
document.getElementById(id).style.display = “none”;
}else{
document.getElementById(id).style.display = “block”;
}
}
#a1{display:none;}
#a2{display:none;}
#a3{display:none;}
#a4{display:none;}
#a5{display:none;}
#a6{display:none;}
#a7{display:none;}
Team ExamPundit
Sponsored
(adsbygoogle = window.adsbygoogle || []).push({});
Books For 2015 Banking/Insurance Exams


