


Direction (1-5):
Study the following graph and answer the questions that follow. The following
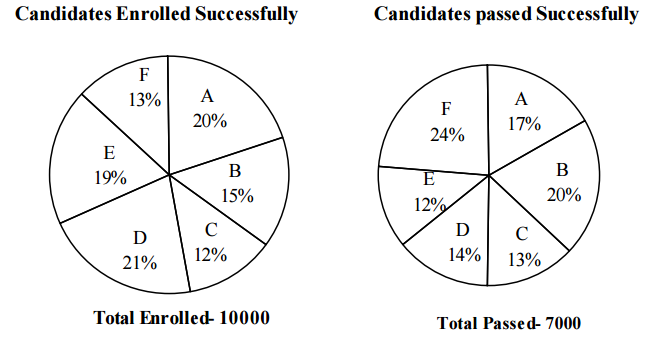
pie chart shows candidates enrolled for Engineering in different colleges and
candidates who successfully completed the course and table show the ratio of
male to female successfully completing the course
Study the following graph and answer the questions that follow. The following
pie chart shows candidates enrolled for Engineering in different colleges and
candidates who successfully completed the course and table show the ratio of
male to female successfully completing the course
|
College
|
Ratio M:F
|
|
A
|
3:5
|
|
B
|
4:3
|
|
C
|
4:5
|
|
D
|
3:2
|
|
E
|
5:7
|
|
F
|
5:3
|
1. The number of
students who successfully completed their course in College C is what per cent
of the total number of students
enrolled for the same?
students who successfully completed their course in College C is what per cent
of the total number of students
enrolled for the same?
(a) 75.83
(b) 72.5
(c) 71.73
(d) 79.95
(e) None of these
2. The number of
girls who successfully completed their course in College D approximately what
per cent of those who completed from
College B?
girls who successfully completed their course in College D approximately what
per cent of those who completed from
College B?
(a) 75%
(b) 30%
(c) 65%
(d) 40%
(e) None of these
3. The ratio of
number of boys who passed from College F to that of number of girls who passed
from College E.
number of boys who passed from College F to that of number of girls who passed
from College E.
(a) 7 : 15
(b) 4 : 5
(c) 15 : 7
(d) 7 : 15
(e) None of these
4. The number of
students enrolled in College B is approximately what per cent of the number of
students enrolled in Colleges C, D, E
& F together?
students enrolled in College B is approximately what per cent of the number of
students enrolled in Colleges C, D, E
& F together?
(a) 25.95%
(b) 23%
(c) 28%
(d) 26%
(e) None of these
5. Find out the
average number of girls enrolled in A, B & C together.
average number of girls enrolled in A, B & C together.
(a) 2050
(b) 2500
(c) 2400
(d) 1700
(e) Cannot be determined
Solutions:
1. Number of students enrolled in State C = 1200, Passed =
910
910
Required percentage = 910×100/1200 =
75.83%
75.83%
2. In College B no of girls who successfully completed the
course = 1400 × 3/7 = 600
course = 1400 × 3/7 = 600
In College D no of girls who successfully completed the
course = 70 × 14× 2/5 = 392
course = 70 × 14× 2/5 = 392
Required % = 392/600 × 100 =
65.33%
65.33%
3. No. of boys who passed from College F 1680 × 5/8 =
1050
1050
No. of girls who passed from College E 840 × 7/12 =
490
490
so, Ratio = 1050/490 = 15/7 =
15:7
15:7
4. Required % = 15/65 ×100 =
23.08% » 23
23.08% » 23
Books For 2015 Banking/Insurance Exams
