


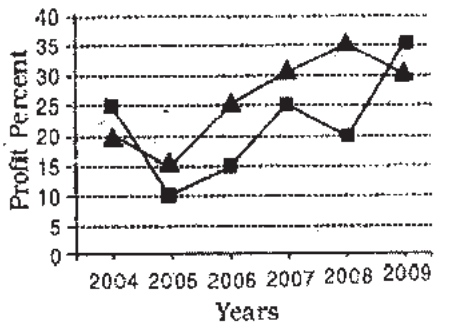
1. If the profit earned by Company L in the year 2005 was Rs.1.84 lakhs. What was the profit earned by the company in the year 2006?
(a) Rs.2.12 lakhs
(b) Rs.2.3 lakhs
(c) Rs.2.04 lakhs
(d) Cannot be determined
(e) None of these
2. If the profit earned by Company M in the year 2008 was Rs.3.63 lakhs. What was the amount of profit earned by it in the year 2006?
(a) Rs.2.16 lakhs
(b) Rs.1.98 lakhs
(c) Rs.2.42 lakhs
(d) Cannot be determined
(e) None of these
3. What is the average percent use in profit of Company L over all the years together?
(a) 15 1⁄3
(b) 25 1⁄3
(c) 18 5⁄6
(d) 21 5⁄6
(e) None of these
4. Which of the following Statements is TRUE with respect in the above graph?
(a) Company M made the highest profit in the year 2009.
(b) Company L made least profit in the year 2005.
(c) The respective ratio between the profits earned by company L and M in the year 2006 was 6 : 5.
(d) Company L made the highest profit in the year 2008.
(e) All are true.
5. What is the percentage increase in percent rise in profit of company M in the year 2009 from the previous year?
(a) 25
(b) 15
(c) 50
(d) 75
(e) None of these
Answers:
1–b
2–c
3–e
4–a
5–d