Hello and welcome to ExamPundit. Here is a set of Data Interpretation Quiz for SBI PO Mains 2015.
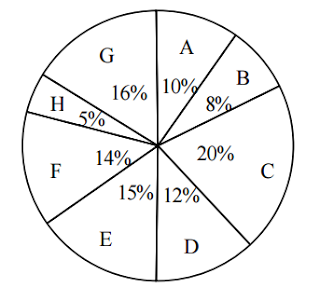
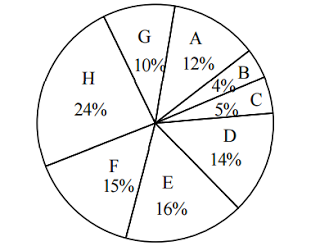
The following pie-chart shows the distribution of the number
of cars of different models produced by a Company in 2008 and 2013.
of cars of different models produced by a Company in 2008 and 2013.
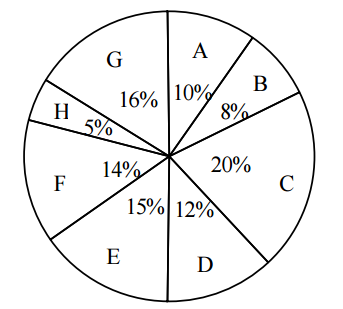
Total cars in the
year 2008 = 32000
year 2008 = 32000
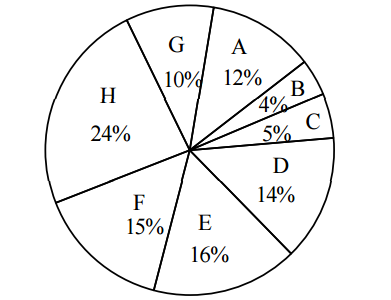
Total cars in the
year 2013 = 60000
year 2013 = 60000
1. What is the
central angle made by cars of Model D, E and F in the year 2008?
central angle made by cars of Model D, E and F in the year 2008?
(a) 147.60
(b) 158.20
(c) 1640
(d) 167.50
(e) 172.50
2. What is the
percentage increase in number of Model A cars produced by the company from 2008
to year 2013?
percentage increase in number of Model A cars produced by the company from 2008
to year 2013?
(a) 75%
(b) 90%
(c) 112.5%
(d) 125%
(e) 137.5%
3. What is the ratio
of the number of cars of model F in the year 2008 to the number of cars of
model H in the year 2013?
of the number of cars of model F in the year 2008 to the number of cars of
model H in the year 2013?
(a) 16 : 35
(b) 10 : 27
(c) 15 : 38
(d) 16 : 45
(e) None of these
4. The number of cars
of Model D in the year 2013 is what percentage of the number of Model C cars in
the year 2008?
of Model D in the year 2013 is what percentage of the number of Model C cars in
the year 2008?
(a) 122.5%
(b) 131.25%
(c) 142.75%
(d) 150%
(e) 152.25%
| Solutions – Car D2013 = 0.14 × 60000 = 8400
Car C2008 = 0.20 × 32000 = 6400
So, Reqd % = 8400/6400 x 100 = 131.25 |
|---|
5. The number of cars
of Model G in the year 2013 is what percentage more than the number of
same-model cars in 2008? (approximate value)
of Model G in the year 2013 is what percentage more than the number of
same-model cars in 2008? (approximate value)
(a) 12%
(b) 17%
(c) 24%
(d) 28%
(e) 35%
Regards
function answer(id){
if(document.getElementById(id).style.display == “block”){
document.getElementById(id).style.display = “none”;
}else{
document.getElementById(id).style.display = “block”;
}
}
#a1{display:none;}
#a2{display:none;}
#a3{display:none;}
#a4{display:none;}
#a5{display:none;}
Team ExamPundit
Sponsored
(adsbygoogle = window.adsbygoogle || []).push({});
Books For 2015 Banking/Insurance Exams