Hello and welcome to ExamPundit. Here is a set of Data Interpretation Quiz which can be used for SBI PO, RBI Assistant and IBPS PO V.
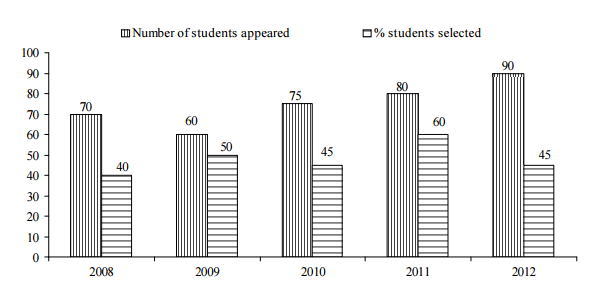
Following bar graph
shows number of students appeared (in thousand) in an engineering entrance
examination and the percentage of students selected in this exam.
shows number of students appeared (in thousand) in an engineering entrance
examination and the percentage of students selected in this exam.
1. In which of the
following years the number of students selected is maximum?
following years the number of students selected is maximum?
(a) 2008
(b) 2009
(c) 2010
(d) 2011
(e) 2012
2. The number of
students selected in the year 2011 is what per cent of the number of students
selected in the year 2009?
students selected in the year 2011 is what per cent of the number of students
selected in the year 2009?
(a) 120%
(b) 125%
(c) 140%
(d) 150%
(e) 160%
| Solutions –
Selected students in 2009 = 50% of 60000
= 30000
Selected students in 2011 = 60% of 80000
= 48000
So, Required % = 48000/30000 x 100 =
160% |
|---|
3. The number of
students selected in the 2012 is how much percentage more than that of the
number of students selected in the
year 2010?
students selected in the 2012 is how much percentage more than that of the
number of students selected in the
year 2010?
(a) 12%
(b) 20%
(c) 24%
(d) 25%
(e) 27.5%
| Solutions –
Selected students in 2012 = 45% of 90000
= 90000 x 45/100 = 40500
Selected students in 2012 = 45% of 75000
= 75000 x 45/100 = 33750
So, % Difference = 40500 – 33750/33750
x 100
= 6750 x 100/33750 = 20%
|
|---|
4. What is the ratio
of the number of students who are not selected in the year 2011 to the number
of students selected in the year
2008?
of the number of students who are not selected in the year 2011 to the number
of students selected in the year
2008?
(a) 3 : 2
(b) 4 : 3
(c) 5 : 4
(d) 7 : 5
(e) 8 : 7
| Solutions –
Students not selected in 2011 = 40% of 80000
= 32000
Selected students in 2008 = 40% of 70000
= 28000
So, Ratio = 32000/28000 = 8/7
= 8 : 7 |
|---|
5. What is the
difference between the average number of students not selected and the average
number of students selected in all five
years?
difference between the average number of students not selected and the average
number of students selected in all five
years?
(a) 2100
(b) 2400
(c) 2700
(d) 2900
(e) 3100
| Solutions –
Average Note Selected Candidates = 194750/5
=38950
Average Selected Candidates = 180250/5
= 36050
So, Difference = 38950 – 36050 = 2900
|
|---|
Regards
function answer(id){
if(document.getElementById(id).style.display == “block”){
document.getElementById(id).style.display = “none”;
}else{
document.getElementById(id).style.display = “block”;
}
}
#a1{display:none;}
#a2{display:none;}
#a3{display:none;}
#a4{display:none;}
#a5{display:none;}
Team ExamPundit
Sponsored
(adsbygoogle = window.adsbygoogle || []).push({});
Books For 2015 Banking/Insurance Exams


