


Hello and welcome to ExamPundit. Here is a set of Data Interpretation Quiz to Test your Speed for SBI PO Prelims.
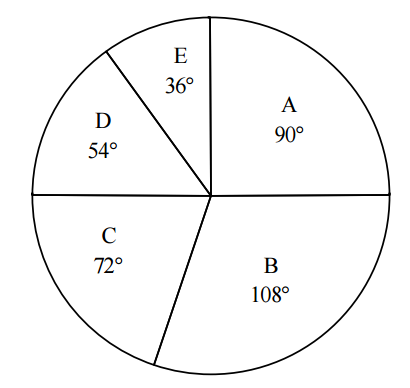
Five different companies A, B, C, D and E make two items I
and II. The total number of items produced by these five companies is 80
thousand. The cost of production of each item is Rs 5000. The percentage
distribution of the total production by these companies is given in the following
pie-chart and the table shows the ratio of production of Item I to that of Item
II and the percentage profit earned by these companies on each of these items.
|
Companies
|
Ratio of Production
|
Per Cent Profit Earned
|
||
|
Item I
|
Item II
|
Item I
|
Item II
|
|
|
A
|
2
|
3
|
20
|
15
|
|
B
|
1
|
2
|
25
|
30
|
|
C
|
2
|
3
|
10
|
12
|
|
D
|
3
|
2
|
15
|
25
|
|
E
|
4
|
1
|
30
|
24
|
1. What is the profit
earned by Company C on Item II?
earned by Company C on Item II?
(a) Rs 57.6 lakhs
(b) Rs 55.4 lakhs
(c) Rs 56.8 lakhs
(d) Rs 54 lakhs
(e) None of these
2. What is the total
cost of production of Item I by companies A and B together?
cost of production of Item I by companies A and B together?
(a) Rs 5 crores
(b) Rs 6 crores
(c) Rs 8 crores
(d) Rs 9 crores
(e) None of these
3. What is the total
of the profit earned by Company E on production of Item I and the profit of
Company D on production of Item II?
of the profit earned by Company E on production of Item I and the profit of
Company D on production of Item II?
(a) Rs 1.56 crores
(b) Rs 2.2 crores
(c) Rs 1.3 crores
(d) Rs 2.6 crores
(e) None of these
4. What is the ratio
of the cost of production of Item II by Company A to the cost of production of
Item I by Company E?
of the cost of production of Item II by Company A to the cost of production of
Item I by Company E?
(a) 17 : 12
(b) 4 : 5
(c) 7 : 4
(d) 15 : 8
(e) 1 : 2
5. The cost of
production of Item II for Company E is what per cent of the cost of production
of Item I for Company A?
production of Item II for Company E is what per cent of the cost of production
of Item I for Company A?
(a) 80%
(b) 20%
(c) 60%
(d) 75%
(e) 40%
Regards
Team ExamPundit
Sponsored
(adsbygoogle = window.adsbygoogle || []).push({});
Books For 2015 Banking/Insurance Exams