Hello and welcome to ExamPundit. Here is a set of Data Interpretation Quiz for SBI PO.
Study the information
carefully to answer the questions that follow :
carefully to answer the questions that follow :
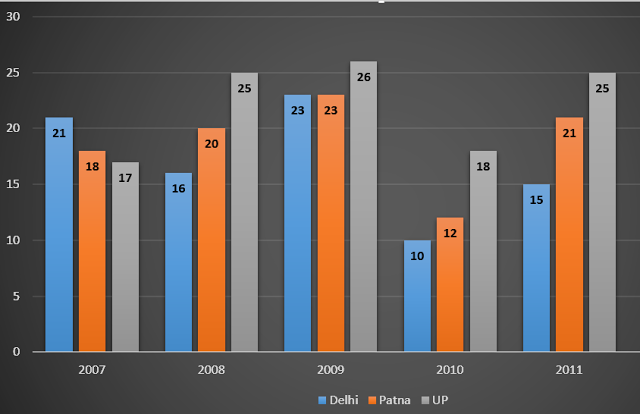
Population of
Different cities (in Lakh):
Different cities (in Lakh):

Percentage break up
of Population in different age group from these cities in different years:
of Population in different age group from these cities in different years:
 |
| Click to Zoom |
1. What is the total
number of people in age group 0 – 18 years from Patna from all the years?
number of people in age group 0 – 18 years from Patna from all the years?
(a) 1.87 Lakh
(b) 187 Lakh
(c) 16.7 Lakh
(d) 18.7 Lakh
(e) None of these
2. What is the ratio
of number of people in age group 40 – 60 years from U.P in 2008 to the number
of people in age group 60+ years in
2010?
of number of people in age group 40 – 60 years from U.P in 2008 to the number
of people in age group 60+ years in
2010?
(a) 125 : 228
(b) 684 : 375
(c) 384 : 375
(d) 484 : 375
(e) 484 : 675
3. The number of
people in age group 18 – 40 years is highest in which year from U.P ?
people in age group 18 – 40 years is highest in which year from U.P ?
(a) 2007
(b) 2009
(c) 2011
(d) 2010
(e) 2008
4. The number of
people in age group 40 – 60 years from Patna in 2008 is what percent of the
number of people in age group 40 –
60 years in U.P from 2011?
people in age group 40 – 60 years from Patna in 2008 is what percent of the
number of people in age group 40 –
60 years in U.P from 2011?
(a) 86.5 %
(b) 88.5 %
(c) 87.5 %
(d) 90.5 %
(e) None of these
5. Total population
of Patna from all the years together is what percent more or less than total
population of Delhi from all the years?
of Patna from all the years together is what percent more or less than total
population of Delhi from all the years?
(a) 10.6 %
(b) 6.52 %
(c) 8.52 %
(d) 8.46 %
(e) None of these
Regards
Team ExamPundit
Sponsored
(adsbygoogle = window.adsbygoogle || []).push({});
Books For 2015 Banking/Insurance Exams