Hello and welcome to ExamPundit. Here is a set of Data Interpretation Quiz for SBI PO 2015.
Study the following
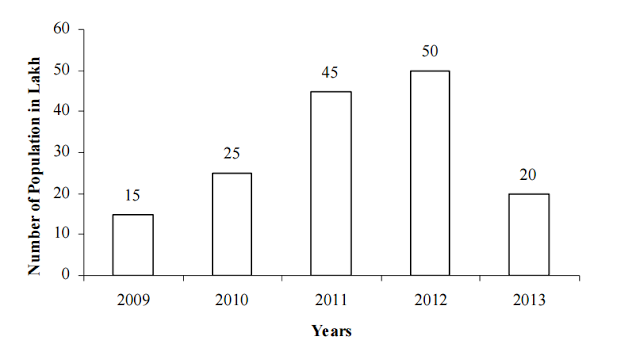
graph carefully to answer the questions that follow :
graph carefully to answer the questions that follow :
Total number of IPL
viewers from 5 different years and the percentage break–up of Men, Female and
Children in them:
viewers from 5 different years and the percentage break–up of Men, Female and
Children in them:

|
Years
|
Male
|
Female
|
Children
|
|
2009
|
52
|
28
|
20
|
|
2010
|
38
|
32
|
30
|
|
2011
|
42
|
26
|
32
|
|
2012
|
34
|
34
|
22
|
|
2013
|
25
|
35
|
40
|
1. What is the
average number of Male watching IPL all the years together?
average number of Male watching IPL all the years together?
(a) 1264000
(b) 1164000
(c) 1146000
(d) 1364000
(e) None of these
2. The number of
Female viewer in IPL is highest in which year?
Female viewer in IPL is highest in which year?
(a) 2010
(b) 2009
(c) 2012
(d) 2011
(e) 2013
3. What is the ratio
of the number of Men watching IPL match in 2009 and 2010 to the number of Female in 2011 and 2012?
of the number of Men watching IPL match in 2009 and 2010 to the number of Female in 2011 and 2012?
(a) 284 : 387
(b) 384 : 287
(c) 287 : 284
(d) 284 : 287
(e) None of these
4. The number of
Female watching IPL in 2009 is what percentage of Number of Children watching
IPL in 2011?
Female watching IPL in 2009 is what percentage of Number of Children watching
IPL in 2011?
(a) 33.30 %
(b) 29.16 %
(c) 43.30 %
(d) 23 %
(e) 53 %
5. The number of
Female watching IPL in 2013 is what percent more or less then number of
Children watching IPL in 2013?
Female watching IPL in 2013 is what percent more or less then number of
Children watching IPL in 2013?
(a) 12.8 % more
(b) 11.8 % less
(c) 10.8 % more
(d) 12 % more
(e) 12.5 % less
Regards
Team ExamPundit
Sponsored
(adsbygoogle = window.adsbygoogle || []).push({});
Books For 2015 Banking/Insurance Exams