Hello and welcome to ExamPundit. Here is a set of Data Interpretation Quiz for SBI PO 2015-16.
Study the following Pie–charts carefully and answer the
following question.
following question.
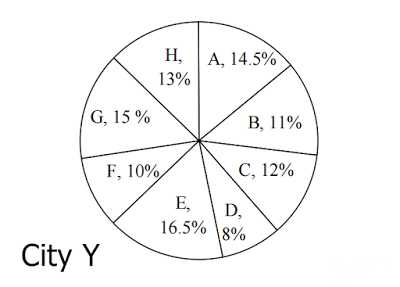
The Pie Charts shows the Percentage distribution of total
voters among different constituency:
voters among different constituency:
Total number of voters in 8 constituencies (A-H) of city X =
1,85,000
1,85,000
 |
Total number of voters in 8 constituency of city Y =
2,76,000
2,76,000

1. What is the total
number of voters from constituency G, H and C from city X ?
number of voters from constituency G, H and C from city X ?
(a) 80,000
(b) 76,000
(c) 74,000
(d) 78,000
(e) 84,000
2. What is the ratio
of voters from city X in constituency H, A and B to the voters from city Y in
G, H and B?
of voters from city X in constituency H, A and B to the voters from city Y in
G, H and B?
(a) 14245 : 21528
(b) 7176 : 21528
(c) 21528 : 14245
(d) 21528 : 4735
(e) None of these
3. Which constituency
has maximum number of voters in city X ?
has maximum number of voters in city X ?
(a) City B
(b) City H
(c) City C
(d) City E
(e) City F
4. Which constituency
has minimum number of voters in city X and city Y ?
has minimum number of voters in city X and city Y ?
(a) City B and C
(b) City D and F
(c) City B and E
(d) City D and D
(e) City B and D
5. Total number of
voters from city E, D and C city X is what percentage of total number of voters
from constituency F, D and C in city
Y ? (Approx)
voters from city E, D and C city X is what percentage of total number of voters
from constituency F, D and C in city
Y ? (Approx)
(a) 72 %
(b) 74 %
(c) 68 %
(d) 76 %
(e) None of these
Solution is in the featured comment!
Regards
Team ExamPundit
Sponsored
(adsbygoogle = window.adsbygoogle || []).push({});
Books For 2015 Banking/Insurance Exams