Hello and welcome to ExamPundit. Here is a set of Data Interpretation Quiz.
Study the following
Pie-chart carefully and answer the questions given below:
Pie-chart carefully and answer the questions given below:
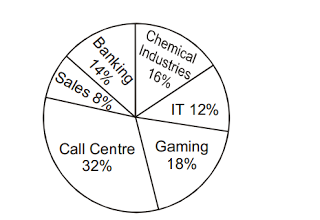
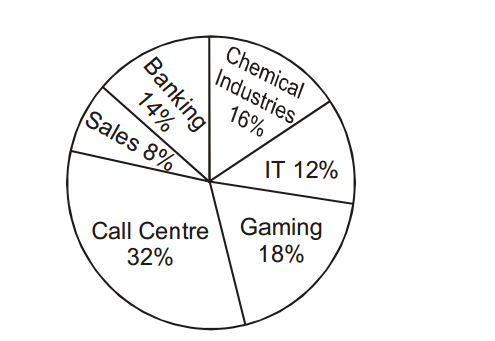
Percentage of People in a city working in Night Shifts from
various Industries
various Industries
(Total number of People-40250)
|
Industries
|
Females
|
|
IT
|
20%
|
|
Gaming
|
20%
|
|
Call Centre
|
45%
|
|
Sales
|
60%
|
|
Banking
|
40%
|
|
Chemical Industries
|
15%
|
1. What is the
respective ratio of men to the women working in night shifts from the Call Centre
industry?
respective ratio of men to the women working in night shifts from the Call Centre
industry?
(a) 9 :11
(b) 7:5
(c) 8:13
(d) 11:7
(e) None of these
2. What is the
approximate average number of females working in night shifts from all the industries
together?
approximate average number of females working in night shifts from all the industries
together?
(a) 2227
(b) 4481
(c) 3326
(d) 2823
(e) 4107
3. What is the total
number of men working in night shifts from all the industries together ?
number of men working in night shifts from all the industries together ?
(a) 28297
(b) 25788
(c) 28678
(d) 26887
(e) None of these
4. The number of
women from the gaming industry are what percent of the total number of people
working in the night shifts from all the
industries together ?
women from the gaming industry are what percent of the total number of people
working in the night shifts from all the
industries together ?
(a) 5.6
(b) 3.6
(c) 3.2
(d) 4.4
(e) None of these
5. What is the
difference between the total number of men and the total number of women working
in night shifts from all the
industries together?
difference between the total number of men and the total number of women working
in night shifts from all the
industries together?
(a) 13254
(b) 13542
(c) 13524
(d) 13363
(e) None of these
Regards
Team ExamPundit
Sponsored
(adsbygoogle = window.adsbygoogle || []).push({});
Books For 2015 Banking/Insurance Exams