Hello and welcome to ExamPundit.
Answer the questions
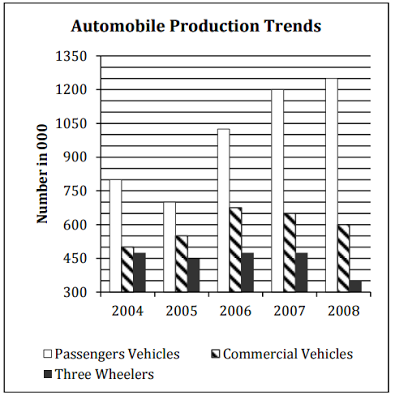
based on the following graphs:
based on the following graphs:


1. Which of the following
year exhibited highest percentage decrease over the preceding year in the automobile production?
year exhibited highest percentage decrease over the preceding year in the automobile production?
(a) 2005
(b) 2006
(c) 2007
(d) 2008
(e) None of them
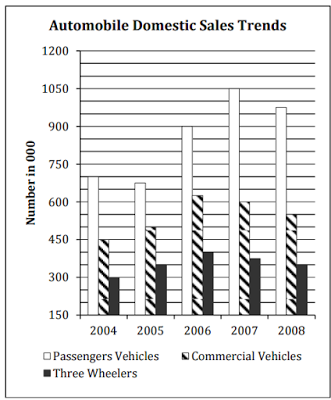
2. Assume whatever that
is not sold domestically was exported, then which year has registered highest growth in exports of automobiles?
is not sold domestically was exported, then which year has registered highest growth in exports of automobiles?
(a) 2005
(b) 2006
(c) 2007
(d) 2008
(e) None of them
3. If the ratio of
the domestic sale price of a commercial vehicle, a passenger vehicle, and a
three wheeler is 5 : 3 : 2 then what
percent of earnings (approximately) is contributed by commercial vehicle segment to the overall earnings
from domestic sales during the period 2004-2008?
the domestic sale price of a commercial vehicle, a passenger vehicle, and a
three wheeler is 5 : 3 : 2 then what
percent of earnings (approximately) is contributed by commercial vehicle segment to the overall earnings
from domestic sales during the period 2004-2008?
(a) 45%
(b) 43%
(c) 11%
(d) 27%
(e) None of them
4. For which year
were the domestic sales of automobiles closest to the average (2004-2008) domestic sales of automobiles?
were the domestic sales of automobiles closest to the average (2004-2008) domestic sales of automobiles?
(a) 2005
(b) 2006
(c) 2007
(d) 2008
(e) None of them
5. Which of the following
years exhibited highest percentage increase over the preceding year in the automobile sales?
years exhibited highest percentage increase over the preceding year in the automobile sales?
(a) 2005
(b) 2006
(c) 2007
(d) 2008
(e) None of them
6. The ratio between
absolute increase in domestic sales over preceding year and absolute increase
in production over the preceding year is
highest during which year?
absolute increase in domestic sales over preceding year and absolute increase
in production over the preceding year is
highest during which year?
(a) 2005
(b) 2006
(c) 2007
(d) 2008
(e) None of them
Answers will be updated after one hour.
Regards
Team ExamPundit
Sponsored
(adsbygoogle = window.adsbygoogle || []).push({});
Books For 2015 Banking/Insurance Exams