Hello and welcome to ExamPundit. Here is a set of Data Interpretation Quiz based on Import and Export.

Analyse the following
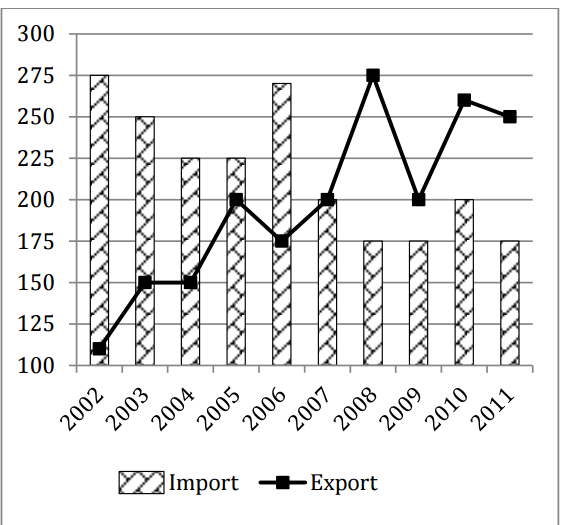
chart showing the exports and imports of XYZ Ltd. and answer the questions based on this chart.
chart showing the exports and imports of XYZ Ltd. and answer the questions based on this chart.
1. Approximately by
what percentage are the total Exports greater/ smaller than the total imports
for the given period?
what percentage are the total Exports greater/ smaller than the total imports
for the given period?
(a) Greater by 9 percent
(b) Smaller by 10 percent
(c) Smaller by 9 percent
(d) Greater by 10 percent
(e) None of them
2. If the absolute
difference between imports and exports are ranked in ascending order, which year
gets 4th rank?
difference between imports and exports are ranked in ascending order, which year
gets 4th rank?
(a) 2010
(b) 2008
(c) 2009
(d) 2011
(e) None of them
3. In which year was
the fifth largest annual percentage increase in exports recorded?
the fifth largest annual percentage increase in exports recorded?
(a) 2007
(b) 2005
(c) 2009
(d) 2008
(e) None of them
4. Which year saw the
second largest annual percentage increase in imports?
second largest annual percentage increase in imports?
(a) 2010
(b) 2005
(c) 2006
(d) 2004
(e) None of them
5. What is the
approximate percentage point difference in the maximum annual percentage
increase in export and the minimum annual percentage decrease in Imports?
approximate percentage point difference in the maximum annual percentage
increase in export and the minimum annual percentage decrease in Imports?
(a) 28
(b) 48
(c) 64
(d) 12
(e) None of them
Regards
Team ExamPundit
Sponsored
(adsbygoogle = window.adsbygoogle || []).push({});
Books For 2015 Banking/Insurance Exams