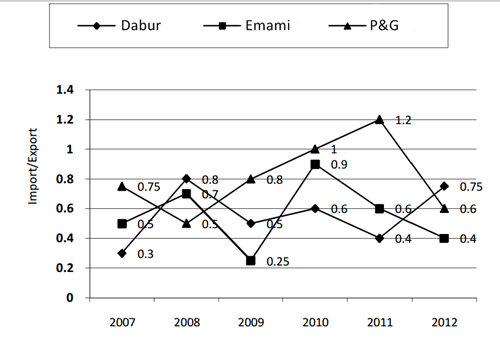
Directions (Q. 1-5): Following line graph shows the ratio of
import to export of three companies over the period of 2007-2012.
import to export of three companies over the period of 2007-2012.
1. If the import of Dabur in the year 2007 was Rs23.58 lakh
what was its export (in Rs) in that year?
(a) 70.74 lakh
(b) 78.24 lakh
(b) 78.24 lakh
(c) 70.8 lakh
(d) 78.60 lakh
(d) 78.60 lakh
(e) 86.5 lakh
2. The ratio of import to export of Dabur in the year 2012
is approximately what per cent of the ratio of import to export of P&G in
the year 2011?
is approximately what per cent of the ratio of import to export of P&G in
the year 2011?
(a) 49.5%
(b) 59%
(b) 59%
(c) 62.5%
(d) 71.2%
(d) 71.2%
(e) 140%
3. If the export of Dabur in the year 2012 and the import of
P&G in the year 2009 were equal to Rs 64 lakh each then the import of Dabur
in the year 2012 was approximately what per cent of the export of P&G in
the year 2009?
P&G in the year 2009 were equal to Rs 64 lakh each then the import of Dabur
in the year 2012 was approximately what per cent of the export of P&G in
the year 2009?
(a) 30%
(b) 45%
(b) 45%
(c) 60%
(d) 75%
(d) 75%
(e) 90%
4. If the import of Dabur and Emami in the year 2009 were Rs
36 lakh and Rs 27 lakh respectively what was the ratio of their exports in that
year?
36 lakh and Rs 27 lakh respectively what was the ratio of their exports in that
year?
(a) 1 : 3
(b) 2 : 3
(b) 2 : 3
(c) 7: 9
(d) 8 : 9
(d) 8 : 9
(e) 7 : 2
5. If the imports of P&G in year 2008 and 2012 were
equal then the export of Company C in year 2008 was approximately what per cent
of its export in year 2012?
equal then the export of Company C in year 2008 was approximately what per cent
of its export in year 2012?
(a) 80%
(b) 90%
(b) 90%
(c) 100%
(d) 110%
(d) 110%
(e) 120%
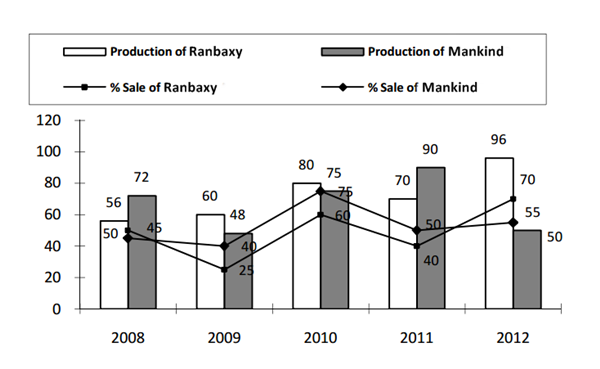
Directions (Q. 6-10): Following line & bar graph shows
the sales and productions(in thousands) of two companies over the period of 2008-2012.
the sales and productions(in thousands) of two companies over the period of 2008-2012.
6. What is the total sale (in thousand) of Ranbaxy during
2008-2012?
2008-2012?
(a) 185
(b) 192
(b) 192
(c) 197
(d) 202
(d) 202
(e) 217
7. The sale of Mankind in year 2010 is approximately what
per cent of the sale of Ranbaxy in the year 2008?
per cent of the sale of Ranbaxy in the year 2008?
(a) 85%
(b) 95%
(b) 95%
(c) 110%
(d) 117%
(d) 117%
(e) 173%
8. What is the average number of sale of Mankind over the
period 2008-2012?
period 2008-2012?
(a) 31400
(b) 32200
(b) 32200
(c) 36070
(d) 32500
(d) 32500
(e) 33000
9. In which of the following years, the percentage rise/fall
in the production of Mankind is the highest on comparison to its previous year?
in the production of Mankind is the highest on comparison to its previous year?
(a) 2008
(b) 2009
(b) 2009
(c) 2010
(d) 2011
(d) 2011
(e) 2012
10. The sale of Ranbaxy in the year 2009 is approximately what
per cent more or less than the sale of Mankind in the year 2011?
per cent more or less than the sale of Mankind in the year 2011?
(a) 20%
(b) 30%
(c) 33.33%
(d) 40%
(e) 50%
Important For: SBI Associates Clerk, NICL AO


