Hello and welcome to ExamPundit. Here is a set of Data Interpretation Quiz.
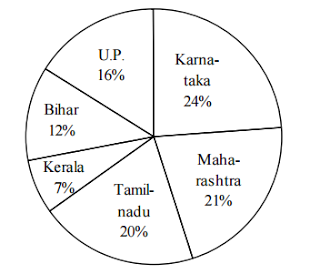
The following pie chart shows the distribution of the total
number of students studying in Engineering colleges of 6 states and the
following table shows the ratio of male to female students and ratio of B.Tech
to M.Tech students.
number of students studying in Engineering colleges of 6 states and the
following table shows the ratio of male to female students and ratio of B.Tech
to M.Tech students.

Total students = 4 lakhs
|
States
|
M : F
|
B.Tech : M.Tech
|
|
Karnataka
|
7
: 5 |
3
: 1 |
|
Maharashtra
|
3
: 1 |
4
: 1 |
|
Tamilnadu
|
3
: 2 |
5
: 3 |
|
U.P.
|
5
: 3 |
13
: 3 |
|
Bihar
|
9
: 7 |
2
: 1 |
|
Kerala
|
4
: 3 |
5
: 2 |
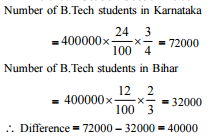
1. What is the
difference between the number of B.Tech students of Karnataka and Bihar?
difference between the number of B.Tech students of Karnataka and Bihar?
(a) 20000
(b) 25000
(c) 30000
(d) 40000
(e) None of these
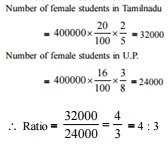
2. What is the ratio
of the female students of Tamil Nadu to those of UP?
of the female students of Tamil Nadu to those of UP?
(a) 3 : 2
(b) 4 : 3
(c) 5 : 4
(d) 3 : 5
(e) None of these
3. What is the number
of female students of Bihar, who are studying in B.Tech?
of female students of Bihar, who are studying in B.Tech?
(a) 18000
(b) 21000
(c) 24000
(d) 25000
(e) Can’t be determined
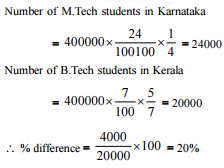
4. The number of
M.Tech students of Karnataka is how much percentage more than the number of
B.Tech students of Kerala?
M.Tech students of Karnataka is how much percentage more than the number of
B.Tech students of Kerala?
(a) 8%
(b) 12%
(c) 15%
(d) 20%
(e) None of these
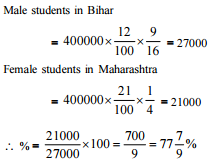
5. The number of
female students of Maharashtra is what percentage of the number of male
students of Bihar?
female students of Maharashtra is what percentage of the number of male
students of Bihar?
(a) 72 1/2%
(b) 77 7/9%
(c) 83 4/9%
(d) 87 3/4%
(e) None of these
Regards
function answer(id){
if(document.getElementById(id).style.display == “block”){
document.getElementById(id).style.display = “none”;
}else{
document.getElementById(id).style.display = “block”;
}
}
#a1{display:none;}
#a2{display:none;}
#a3{display:none;}
#a4{display:none;}
#a5{display:none;}
Team ExamPundit
Sponsored
(adsbygoogle = window.adsbygoogle || []).push({});
Books For 2015 Banking/Insurance Exams