Hello and welcome to ExamPundit. Here is a set of Data Interpretation Quiz.
Check the previous set from here.
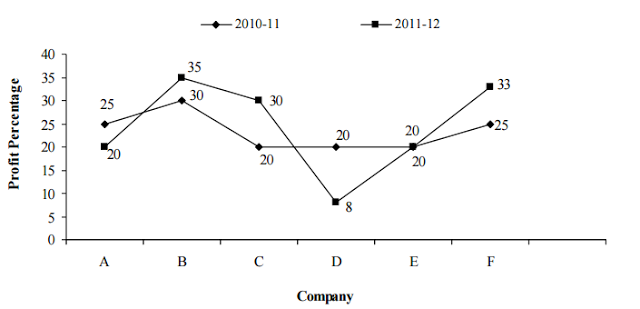
Study the graph and
answer the questions that follow:
answer the questions that follow:

Profit percentage of
six companies in two successive years
six companies in two successive years
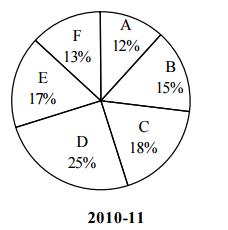
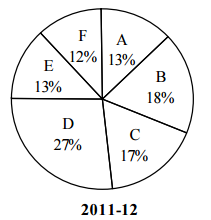
The pie-chart show
the proportion of Income of companies. during two successive years
the proportion of Income of companies. during two successive years
Total Income 750 Crore
Total Income 800 Crore
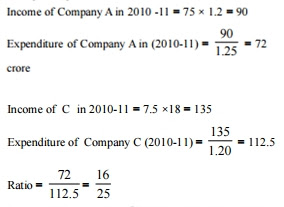
1. What is the ratio
of the expenditure of Company A to that of Company C in 2010-11?
of the expenditure of Company A to that of Company C in 2010-11?
(a) 4 : 5
(b) 5 : 4
(c) 16 : 25
(d) 25 : 16
(e) None of these
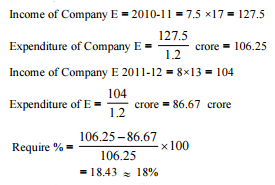
2. What is the
approximate percentage increase/decrease in expenditure made by Company E in
2011-12 with respect to its previous year?
approximate percentage increase/decrease in expenditure made by Company E in
2011-12 with respect to its previous year?
(a) 12%
(b) 14%
(c) 27%
(d) 18%
(e) None of these
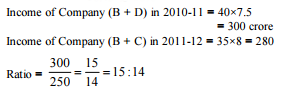
3. Find out the ratio
of income of Company B and D together in the year 2010-11 to that of Company B
and C in 2011-12.
of income of Company B and D together in the year 2010-11 to that of Company B
and C in 2011-12.
(a) 7 : 6
(b) 6 : 7
(c) 14 : 15
(d) 15 : 14
(e) None of these
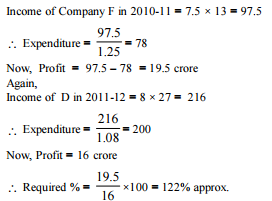
4. The profit of the
Company F in 2010-11 is approximately what per cent of profit of Company D in
the year 2011-12?
Company F in 2010-11 is approximately what per cent of profit of Company D in
the year 2011-12?
(a) 125%
(b) 90%
(c) 122%
(e) 130%
(e) None of these
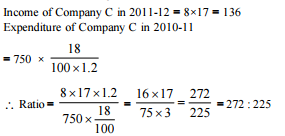
5. What is the ratio
of income of Company C in 2011-12 to expenditure of Company C in 2010-11?
of income of Company C in 2011-12 to expenditure of Company C in 2010-11?
(a) 30 : 23
(b) 272 : 225
(c) 4 : 5
(d) 5 : 3
(e) Can’t be determined
Check the previous set from here.
Regards
function answer(id){
if(document.getElementById(id).style.display == “block”){
document.getElementById(id).style.display = “none”;
}else{
document.getElementById(id).style.display = “block”;
}
}
#a1{display:none;}
#a2{display:none;}
#a3{display:none;}
#a4{display:none;}
#a5{display:none;}
Team ExamPundit
Sponsored
(adsbygoogle = window.adsbygoogle || []).push({});
Books For 2015 Banking/Insurance Exams