Hello and welcome to ExamPundit. Here is a set of Data Interpretation Quiz based on 3 Pi Charts.
Study the following
Pi–chart and answer questions that follow :
Pi–chart and answer questions that follow :
Percentage
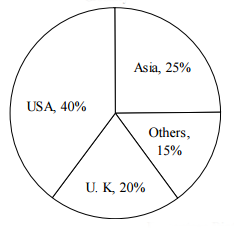
Distribution of steel Production in Globally
Distribution of steel Production in Globally
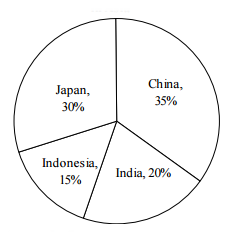
Percentage Distribution
of steel production in Asia
of steel production in Asia
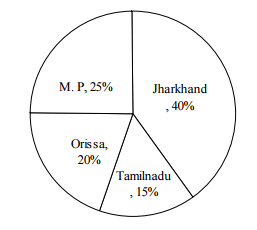
Percentage
Distribution of steel production by different states in India
Distribution of steel production by different states in India
1. If USA produces
360000 mt. tonnes steel. Find production of steel in Jharkhand ?
360000 mt. tonnes steel. Find production of steel in Jharkhand ?
(a) 15,000 mt.
(b) 17,000 mt.
(c) 18,000 mt.
(d) 19,000 mt.
(e) None of these
2. Jharkhand produces
what percent of steel, from the steel produced by globally ?
what percent of steel, from the steel produced by globally ?
(a) 5 %
(b) 3 %
(c) 2 %
(d) 6 %
(e) None of these
3. If China produced
70,000 mt. steel, find steel produced by M. P ?
70,000 mt. steel, find steel produced by M. P ?
(a) 12,000 mt.
(b) 10,000 mt.
(c) 15,000 mt.
(d) 18,000 mt.
(e) None of these
4. Production of
steel in USA, is how many times from the steel produced by M. P ?
steel in USA, is how many times from the steel produced by M. P ?
(a) 30
(b) 36
(c) 38
(d) 32
(e) None of these
5. If Japan produces
90,000 mt. steel, find steel produced by UK and Orissa ?
90,000 mt. steel, find steel produced by UK and Orissa ?
(a) 2.4 lakhs mt. and 12,000 mt.
(b) 3.4 lakhs mt. and 13,000 mt.
(c) 12,000 mt. and 2.4 lakhs mt.
(d) 13,000 mt. and 3.4 lakh mt.
(e) None of these
6. If difference of
steel production between M. P and Orissa is 60,000 mt., find production of
steel in USA?
steel production between M. P and Orissa is 60,000 mt., find production of
steel in USA?
(a) 76 lakh mt.
(b) 96 lakh mt.
(c) 86 lakh mt.
(d) 90 lakh mt.
(e) None of these
Regards
Team ExamPundit
Sponsored
(adsbygoogle = window.adsbygoogle || []).push({});
Books For 2015 Banking/Insurance Exams