


Hello and welcome to exampundit. Here is a set of Data Interpretation Quiz for upcoming Bank and Insurance Exams.
Directions (Q. 1-6): The following charts give data about
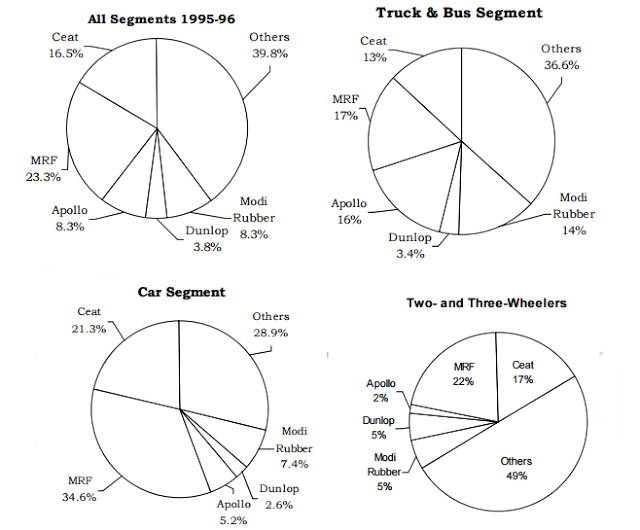
the “total” and “segment-wise” market shares of all the rubber companies in
India, for the year 1995-1996.
the “total” and “segment-wise” market shares of all the rubber companies in
India, for the year 1995-1996.

The total sales of Apollo in 1995-96 were Rs. 1245 crore;
this was because of a 25% growth over the previous year’s sales. Apollo’s sales
in the car segment was Rs 208 crore. The truck and bus segment constituted 40%
of the total sales in 1995-96.
this was because of a 25% growth over the previous year’s sales. Apollo’s sales
in the car segment was Rs 208 crore. The truck and bus segment constituted 40%
of the total sales in 1995-96.
1. Apollo’s sales in the “two-and three-wheelers” segments
was Rs
was Rs
1) 82 crore
2) 75 crore
3) 70 crore
4) Can’t be determined
5) None of these
2. The sales in the truck and bus segment exceeded those in
the car segment by
the car segment by
1) 50%
2) 75%
3) 100%
4) 150%
5) None of these
3. Which of the following had the maximum value of sales?
1) Apollo in truck & bus segment
2) Ceat in two- and three-wheelers
3) Ceat in car segment
4) Modi Rubber in all segments
5) None of these
4. The sales by MRF in the truck and bus segment was
1) Rs 840 crore
2) Rs 1384 crore
3) Rs 1020 crore
4) Rs 1395 crore
5) None of these
5. Apollo’s sales in 1994-95 was
1) Rs 996 crore
2) Rs 1156 crore
3) Rs 750 crore
4) Rs 781 crore
5) None of these
6. If the sales of Car segment and Two- and Three-Wheeler
segments are mixed, the overall share of Ceat is 18.7% in year 1995-96. The
total share of Two- and Three-Wheeler segment is what % more/less than that of
the Car segment?
segments are mixed, the overall share of Ceat is 18.7% in year 1995-96. The
total share of Two- and Three-Wheeler segment is what % more/less than that of
the Car segment?
1) 13.7% less
2) 44.4% more
3) 37.7% more
4) Can’t be determined
5) None of these
Directions (7-11): Refer to the bar graph below and answer
the questions that follow.
the questions that follow.

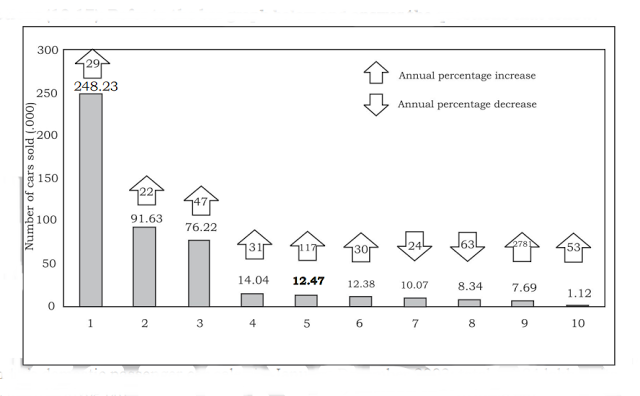
India’s domestic passenger car sales in January-December
2003; total = 4.84 lakh units
2003; total = 4.84 lakh units
1. Maruti Udyog Ltd 2.
Hyundai Motors India Ltd
Hyundai Motors India Ltd
3. Tata Motors Ltd 4.
Ford India Ltd
Ford India Ltd
5. General Motors Ltd 6.
Honda Seie Cars India Ltd
Honda Seie Cars India Ltd
7. Hindustan Motors Ltd 8.
Fiat India Pvt Ltd
Fiat India Pvt Ltd
9. Toyota Kirloskar Motor Pvt Ltd 10. Daimler-Chrysler India Pvt Ltd
7. In 2003, how many units are sold by companies other than
those given in the chart?
those given in the chart?
1) 2320
2) 1810
3) 3805
4) 2830
5) None of these
8. How many units of cars were sold by the given companies
in the year 2002?
in the year 2002?
1) 480000
2) 420340
3) 382120
4) 342140
5) None of these
9. If annual percentage change remains the same for Ford
India Ltd and Hindustan Motors Ltd for the year 2004, then what will be the
difference between the numbers of cars sold by these two companies in year
2004?
India Ltd and Hindustan Motors Ltd for the year 2004, then what will be the
difference between the numbers of cars sold by these two companies in year
2004?
1) 9740
2) 11400
3) 10739
4) 12742
5) None of these
10. In year 2002, how many companies sold more than 10000
cars?
cars?
1) 6
2) 5
3) 4
4) 2
5) None of these
11. What percentage of combined sales of General Motors Ltd,
Fiat India Pvt Ltd and Tata Motors Ltd in year 2003 is the combined sales of
Hindustan Motors Ltd, Ford India Ltd, Hyundai Motors Ltd?
Fiat India Pvt Ltd and Tata Motors Ltd in year 2003 is the combined sales of
Hindustan Motors Ltd, Ford India Ltd, Hyundai Motors Ltd?
1) 100%
2) 80%
3) 120%
4) 95%
5) None of these
Answers:
- 2
- 1
- 4
- 3
- 1
- 2
- 2
- 3
- 3
- 1
- 3
Solutions:
1-6: In the beginning, please note that all the pie charts add up to hundred, so the shares given are the per cent shares.
- Apollo’s share in all segments is 8.3% in 1995-96 = Rs 1245 crore.
- Total sales in 1995-96 = (1245) (100)/8.3 = Rs 15000 crore;
- Apollo’s share in car segment is 5.2% = Rs 208 crore.
- Total sales in car segment = (208) (100)/5.2 = Rs 4000 crore;
- Total sales in trucks & buses segment = 40% of total sales = (40) (15000)/100 = Rs 6000 crore;
- Total sales in two- & three-wheeler segment = (15000 – 4000 – 6000) = Rs 5000 crore.
1. Apollo’s sales in two- & three-wheeler segment = (1.5) (5000) / 100 = Rs 75 crore.
2. Sales in the truck & bus segment exceeded that in the car segment by = (6000 – 4000) (100)/(4000) = 50%.
3. Apollo’s sales in truck & bus segment = 16% of 6000 = Rs 960 crore.
Ceat’s sales in two- and three-wheeler segment = 16.9% of 5000 = Rs. 845 crore.
Ceat’s sales in car segment = 21.3% of 4000 = Rs. 852 crore.
Modi Rubber sales in all segments = 8.3% of 15000 = Rs 1245 crore
Among the above, Modi Rubber sales in all segments is the maximum.
4. MRF sales in truck & bus segment = (6000) (17)/(100) = Rs 1020 crore.
5. Apollo’s sales in 1994-95 = (1245)/(1.25) = Rs 996 crore.
6. 18.7% is the overall share of Car segment and Two- and Three-Wheeler segment. Therefore as per the method of alligation: 18.7% is the weighted mean of 21.3% and 16.9%.
7. Total number of units sold by the given companies
= 248.23 + 91.63 + 76.22 + 14.04 + 12.47 + 12.38 + 10.07 + 8.34 + 7.69 + 1.12
= 482.19 = 482190
Total number of units sold = 484000.
Cars sold by companies other than those given in the chart = 484000 – 482190 = 1810
8. 382.12
9. Sales of Ford India Ltd in 2004 = 14.04 × 1.31 = 18.3924
Sale of Hindustan Motors Ltd in 2004 = 10.07 × 0.76 = 7.6532
Difference = 18392 – 7653 = 10739.
10. We can find that only 6 companies managed to sell more than 10000 cars in year 2002.
11. In 2003, combined sales of Hindustan Motors Ltd, Ford India Ltd and Hyundai Motors Ltd
= 10.07 + 14.04 + 91.63 = 115.74
Combined sale of General Motors Ltd, Fiat India Pvt Ltd and Tata Motors Ltd
= 12.47 + 8.34 + 76.22 = 97.03
Required % = 115.74/97.03 x 100 = 119.28 or 120%
Sponsored
(adsbygoogle = window.adsbygoogle || []).push({});
Regards
Team ExamPundit