Hello and welcome to ExamPundit. Here is a set of Quantitative Aptitude Quiz based on Data Interpretation for Bank and Insurance Exams.
DIRECTIONS (Q. 1-5) :
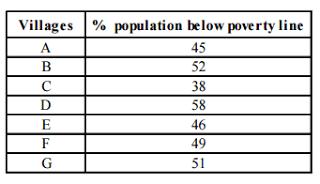
Study the following chart to answer the questions given below :
Study the following chart to answer the questions given below :

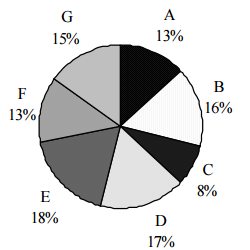
Proportion of
population of seven villages in 1995
population of seven villages in 1995
1. In 1996, the
population of villages A as well as B is increased by 10% from the year 1995.
If the population of village A in 1995
was 5000 and the percentage of population below poverty line in 1996 remains same as in 1995, find approximately
the population of village B below poverty line in 1996.
population of villages A as well as B is increased by 10% from the year 1995.
If the population of village A in 1995
was 5000 and the percentage of population below poverty line in 1996 remains same as in 1995, find approximately
the population of village B below poverty line in 1996.
(a) 4000
(b) 45000
(c) 2500
(d) 3500
(e) None of these
2. If in 1997 the
population of village D is increased by 10% and the population of village G is
reduced by 5% from 1995 and the
population of village G in 1995 was 9000, what is the total population of
villages D and G in 1997?
population of village D is increased by 10% and the population of village G is
reduced by 5% from 1995 and the
population of village G in 1995 was 9000, what is the total population of
villages D and G in 1997?
(a) 19770
(b) 19200
(c) 18770
(d) 19870
(e) None of these
3. If in 1995 the
total population of the seven villages together was 55,000 approximately, what
will be population of village F in
that year below poverty line ?
total population of the seven villages together was 55,000 approximately, what
will be population of village F in
that year below poverty line ?
(a) 3000
(b) 2500
(c) 4000
(d) 3500
(e) None of these
4. If the population
of village C below poverty line in 1995 was 1520, what was the population of
village F in 1995 ?
of village C below poverty line in 1995 was 1520, what was the population of
village F in 1995 ?
(a) 4000
(b) 6000
(c) 6500
(d) 4800
(e) None of these
5. The population of
village C is 2000 in 1995. What will be the ratio of population of village C
below poverty line to that of the
village E below poverty line in that year ?
village C is 2000 in 1995. What will be the ratio of population of village C
below poverty line to that of the
village E below poverty line in that year ?
(a) 207 : 76
(b) 76 : 207
(c) 152 : 207
(d) Data inadequate
(e) None of these
Directions (Q. 6-11):
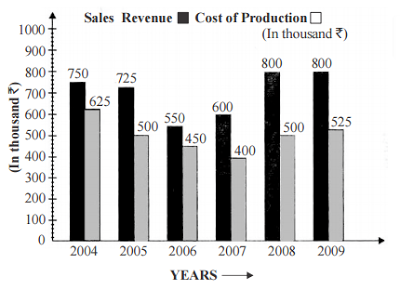
In the following multiple bar diagram, the data regarding cost of production
and sales revenue of the company XYZ in the given years have been given. Study
the bar diagram carefully and answer the questions.
In the following multiple bar diagram, the data regarding cost of production
and sales revenue of the company XYZ in the given years have been given. Study
the bar diagram carefully and answer the questions.

6. By what per cent
is the amount received from the sales in the year 2005 of the company, more
than the expenditure on production
in the year 2008?
is the amount received from the sales in the year 2005 of the company, more
than the expenditure on production
in the year 2008?
(a) 45%
(b) 40%
(c) 48%
(d) 49%
(e) 50%
7. In how many years
the cost of production is more than the average cost of production of the given
years ?
the cost of production is more than the average cost of production of the given
years ?
(a) 1
(b) 2
(c) 3
(d) 4
(e) None of these
8. In how many years
the sales revenue is less than the average sales revenue of the given years?
the sales revenue is less than the average sales revenue of the given years?
(a) 1
(b) 3
(c) 2
(d) 4
(e) None of these
9. If the cost of
production in 2004 and 2007 be increased by 25% and 30% respectively, then by
what per cent will the total cost in
these both years be more than the sales revenue of the year 2008 ?
production in 2004 and 2007 be increased by 25% and 30% respectively, then by
what per cent will the total cost in
these both years be more than the sales revenue of the year 2008 ?
(a) 62.7%
(b) 65.7%
(c) 67.7%
(d) 68.5%
(e) None of these
10. In which year the
company had maximum profit per cent ?
company had maximum profit per cent ?
(a) 2008
(b) 2007
(c) 2006
(d) 2005
(e) 2004
11. If the sales
revenues in the years 2005, 2006 and 2007 increase by 20%, 25% and 30%
respectively and the costs of
production in the years 2007, 2008 and 2009 increase by 20%, 25% and 35% respectively, what will be the difference between
average sales revenue and average cost of production?
revenues in the years 2005, 2006 and 2007 increase by 20%, 25% and 30%
respectively and the costs of
production in the years 2007, 2008 and 2009 increase by 20%, 25% and 35% respectively, what will be the difference between
average sales revenue and average cost of production?
(a) Rs. 185.59 thousands
(b) Rs. 188.59 thousands
(c) Rs. 174.59 thousands
(d) Rs. 200.59 thousands
(e) None of these
:: View Solutions ::
Regards
Team ExamPundit
Sponsored
(adsbygoogle = window.adsbygoogle || []).push({});
Books For 2015 Banking/Insurance Exams