


Hello and welcome to exampundit. Today we are sharing an Data Interpretation Quiz for Bank PO Prelims Exam.
Data Interpretation is one of the most important topic of IBPS PO, IBPS Clerk, SBI PO & Clerk exams. We have explained already How to prepare Data Interpretation for Bank Exams. Today we are sharing 2 DIs, One is on Bar Graph and second is based on Pie Chart + Linear Graph + Bar Graph.
The following set consists 10 questions on Data Interpretation Questions with 10 minutes in hand.
[WpProQuiz 249]
Data Interpretation Quiz for Bank Exams
Study the following bar chart carefully and answer the given questions:
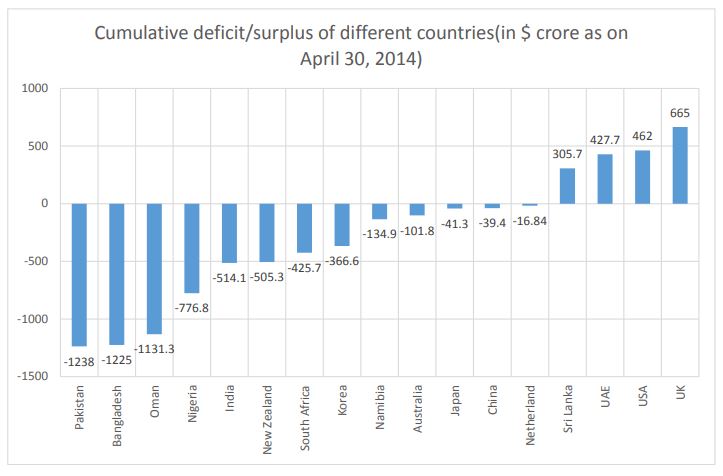
The total of the first three deficit countries (in $ million) = $3594.3. The total of the next five deficit countries (in $ million) = $2588.5. The total of the last five deficit countries (in $ million) – $334.2. The total of the four surplus countries (in $ million) = $1860.4
Q1. The country whose surplus is nearly equal to the average of the 4 surplus countries is
(1) Sri Lanka
(2) UAE
(3) USA
(4) UK
(5) None of these
Q2. The ratio of the deficit of the last five deficit countries to the overall deficit of all the deficit countries is nearly equal to
(1) 0.513:1
(2) 0.0513:1
(3) 0.712:1
(4) 0.0712:1
(5) None of these
Q3. The average of the total deficit of the middle five deficit countries is nearly the deficit of which country?
(1) India
(2) New Zealand
(3) Nigeria
(4) South Africa
(5) None of these
Q4. The ratio of net deficit to net surplus is equal to
(1) 6517:2588.5
(2) 6517:1860.4
(3) 6571:3594.3
(4) Can’t be determined
(5) None of these
Q5. The ratio of the difference between the highest and the lowest of the surplus countries to the difference between the deficit of Bangladesh and Oman is
(1) 3539:1225
(2) 3593:937
(3) 3359:1131
(4) 3593:397
(5) None of these
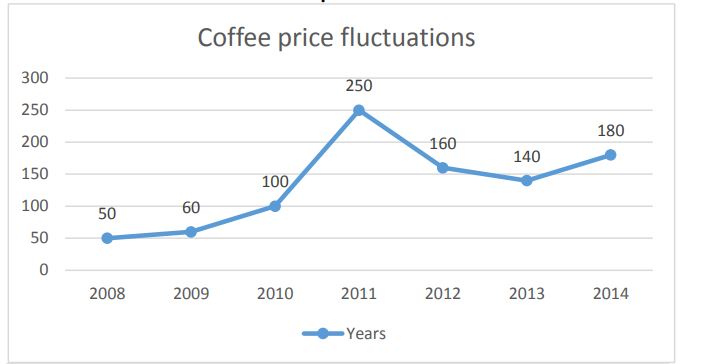
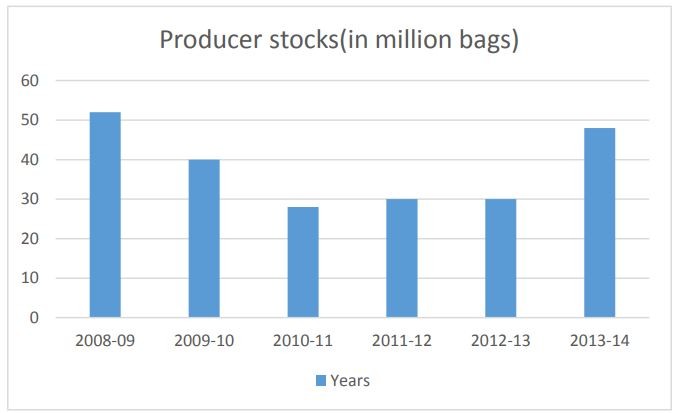
Refer to the following figures.
World coffee products
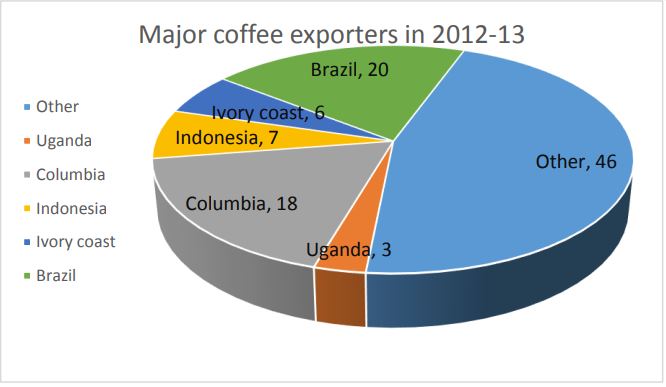
Total coffee exports in 2012-13 = 62.9 million bags
1 Bag – 60kg
Average price of coffee in X-Y years = (Price in X + Price in Y)/2
Q6. How many million kilograms of coffee was exported by Brazil in 2012-13?
(1) 775
(2) 755
(3) 535
(4) 345
(5) None of these
Q7. Coffee prices showed the greatest increase between
(1) 2010-11
(2) 2011-12
(3) 2012-13
(4) 2013-14
(5) None of these
Q8. In 2012-13, what was Uganda’s earning approximately by way of coffee exports?
(1) $170 million
(2) $150 million
(3) $190 million
(4) $200 million
(5) None of these
Q9. Find the value of coffee stocks with producers in 2008-09?
(1) $2000 million
(2) $3000 million
(3) $1815 million
(4) $1518 million
(5) None of these
Q10. During which period was the value of coffee with producers highest?
(1) 2010-11
(2) 2011-12
(3) 2012-13
(4) 2013-14
(5) None of these
Let us know in the comment section if you have liked our quiz. Your comments are extremely motivating for us. Also, do share the quizzes with your Friends and co-aspirants.
All the best.
Regards
Team Exampundit