
Hello and welcome to ExamPundit. Here is another Set of Data Interpretation containing Graph Chart and Table Data.
Direction (Q. 1-5):
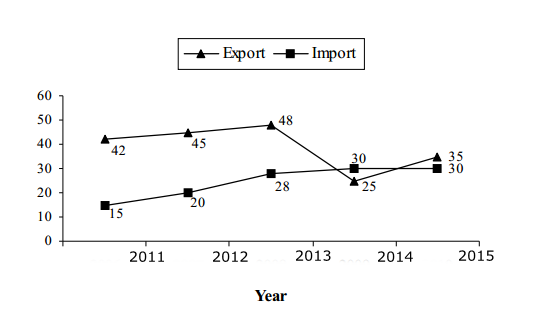
The following graph
shows the export and Import (in lacs) of Company P through 2011-15:
shows the export and Import (in lacs) of Company P through 2011-15:
Ratio of Export and
Import of Company P and Q (P : Q) through these years is as follows:
Import of Company P and Q (P : Q) through these years is as follows:
|
Year
|
Export(P:Q)
|
Import(P:Q)
|
|
2011
|
3:5
|
3:7
|
|
2012
|
3:4
|
4:9
|
|
2013
|
4:7
|
7:10
|
|
2014
|
5:8
|
6:5
|
|
2015
|
7:9
|
3:8
|
1. Export of ‘Q’ in 2011.
Is how much percentage more or less than export of P in 2011?
Is how much percentage more or less than export of P in 2011?
(a) 60.34%
(b) 64.66%
(c) 66.66%
(d) 67.85%
(e) 70%
2. Average import of
‘Q’ is how much percentage more or less than average export of ‘Q’?
‘Q’ is how much percentage more or less than average export of ‘Q’?
(a) 26.9% more
(b) 34.2% less
(c) 24.7% less
(d) 22.7% more
(e) Both are equal
3. What is the
difference between total import of company Q and total export of Company P?
difference between total import of company Q and total export of Company P?
(a) 32 units
(b) 30 units
(c) 28 units
(d) 40 units
(e) 25 units
4. What is the
difference between export of Q in 2014 and import of P in 2013?
difference between export of Q in 2014 and import of P in 2013?
(a) 10 units
(b) 11 units
(c) 12 units
(d) 13 units
(e) 9 units
5. Import of Q in 2013
is how much percentage more or less then the export of ‘P’ in 2014?
is how much percentage more or less then the export of ‘P’ in 2014?
(a) 50%
(b) 40%
(c) 70%
(d) 65%
(e) 60%
Solutions:
|
Year
|
Export
|
Import
|
|
2011
|
70
|
35
|
|
2012
|
60
|
45
|
|
2013
|
84
|
40
|
|
2014
|
40
|
25
|
|
2015
|
45
|
80
|
Regards
Team ExamPundit
Books For 2015 Banking/Insurance Exams