


Hello and welcome to exampundit. Here is a set of Data Interpretation Quiz for upcoming Syndicate Bank PGDBF and IBPS Clerk Mains.
1-5:
Answer the questions based on the following information. The amount of money invested (rupees in crores) in the core infrastructure areas of two districts, Chittoor and Khammam, Andhra Pradesh, is as follows.
| Chittoor district | Khammam district | ||||
| Core Area | 1995 | 1996 | Core Area | 1995 | 1996 |
| Electricity | 815.2 | 1054.2 | Electricity | 2065.8 | 2365.1 |
| Chemical | 389.5 | 476.7 | Chemical | 745.3 | 986.4 |
| Thermal | 632.4 | 565.9 | Thermal | 1232.7 | 1026.3 |
| Solar | 468.1 | 589.6 | Solar | 1363.5 | 1792.1 |
| Nuclear | 617.9 | 803.1 | Nuclear | 1674.3 | 2182.1 |
| Total | 2923.1 | 3489.5 | Total | 7081.6 | 8352.0 |
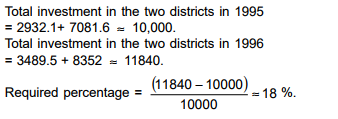
- By what per cent was the total investment in the two districts more in 1996 as compared to 1995?
1) 14%
2) 21%
3) 24%
4) 18%
Option: D
Explanation:
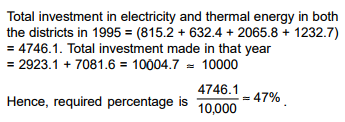
- The investment in electricity and thermal energy in 1995 in these two districts formed what per cent of the total investment made in that year?
1) 41%
2) 47%
3) 52%
4) 55%
Option: B
Explanation:
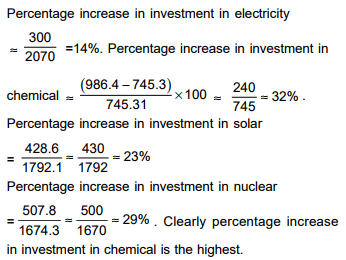
- In Khammam district, the investment in which area in 1996 showed the highest percentage increase over the investment in that area in 1995?
1) Electricity
2) Chemical
3) Solar
4) Nuclear
Option: B
Explanation:
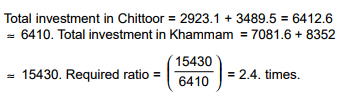
- Approximately how many times was the total investment in Chittoor to the total investment in Khammam?
1) 2.8
2) 2
3) 2.4
4) 1.7
Option: C
Explanation:
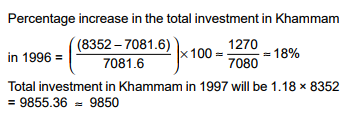
- If the total investment in Khammam shows the same rate of increase in 1997, as it had shown from 1995 to 1996, what approximately would be the total investment in Khammam in 1997?
1) ₹ 9,850 crore
2) ₹ 10,020 crore
3) ₹ 9,170 crore
4) ₹ 8,540 crore
Option: A
Explanation:
6-10:
Answer the questions based on the following information. Mulayam Software Co., before selling a package to its clients, follows the given schedule.
| Month | Stage | Cost (₹ ‘000 per man /month) |
| 1-2 | Specification | 40 |
| 3-4 | Design | 20 |
| 5-8 | Coding | 10 |
| 9-10 | Testing | 15 |
| 11-15 | Maintenance | 10 |
The number of people employed in each month is:
| Month | 1 | 2 | 3 | 4 | 5 | 6 | 7 | 8 | 9 | 10 | 11 | 12 | 13 | 14 | 15 |
| Number of people employed | 2 | 3 | 4 | 3 | 4 | 5 | 5 | 4 | 4 | 1 | 3 | 3 | 1 | 1 | 1 |
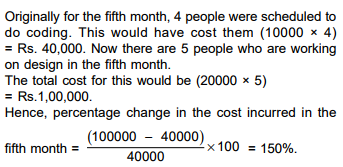
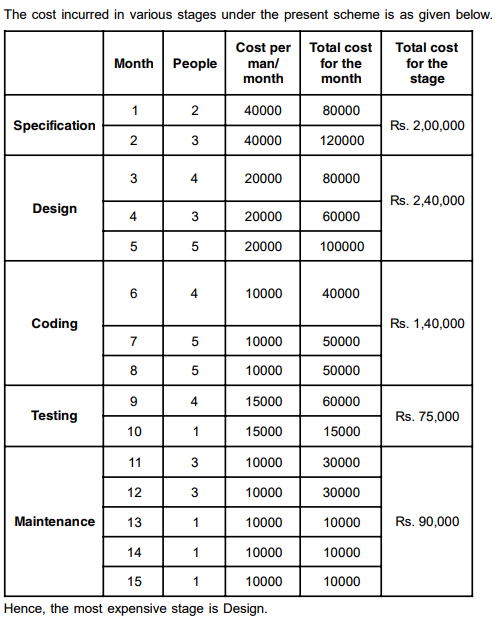
- Due to overrun in ‘design’, the design stage took 3 months, i.e. months 3, 4 and 5. The number of people working on design in the fifth month was 5. Calculate the percentage change in the cost incurred in the fifth month. (Due to improvement in ‘coding’ technique, this stage was completed in months 6-8 only.)
1) 225%
2) 150%
3) 275%
4) 240%
Option: B
Explanation:
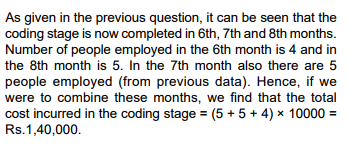
- With reference to the above question, what is the cost incurred in the new ‘coding’ stage? (Under the new technique, 4 people work in the sixth month and 5 in the eighth.)
1) ₹ 1,40,000
2) ₹ 1,50,000
3) ₹ 1,60,000
4) ₹ 1,70,000
Option: A
Explanation:
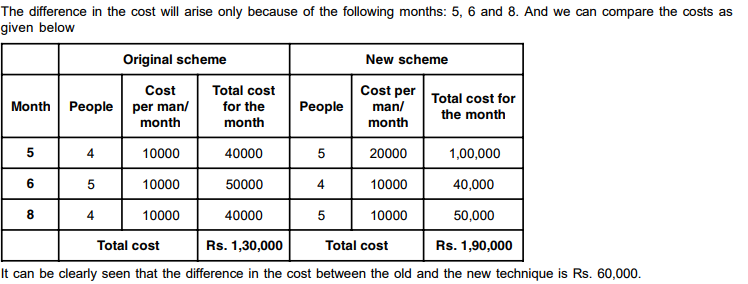
- What is the difference in cost between the old and the new techniques?
1) ₹ 30,000
2) ₹ 60,000
3) ₹ 70,000
4) ₹ 40,000
Option: B
Explanation:
- Under the new technique, which stage of software development is most expensive for Mulayam Software Co.?
1) Testing
2) Specification
3) Coding
4) Design
Option: D
Explanation:
- Which five consecutive months have the lowest average cost per man-month under the new technique?
1) 1-5
2) 9-13
3) 11-15
4) None of these
Ace Data Interpretation for Bank PORead Now
Regards
Team EP