Hello and welcome to ExamPundit.
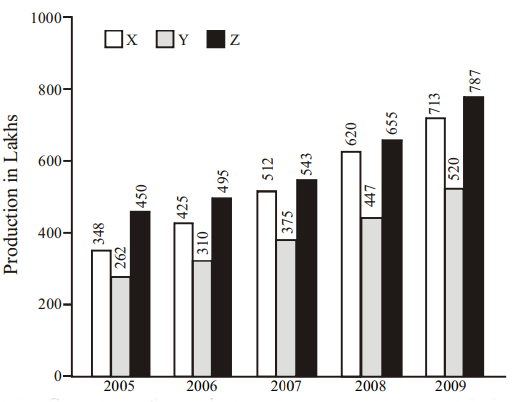
The following bar chart gives the production of cycles by
three different companies X, Y and Z for different years. Study this chart to
answer the questions that follow.
three different companies X, Y and Z for different years. Study this chart to
answer the questions that follow.
1. Considering the
production of each company separately, in how many instances, is the percentage
increase in the production of cycles
over the previous year’s production greater than 20% ?
production of each company separately, in how many instances, is the percentage
increase in the production of cycles
over the previous year’s production greater than 20% ?
(a) 4
(b) 6
(c) 5
(d) 7
(e) None of these
2. The annual
percentage increase in the total production of cycles from 2005 to 2009 was :
percentage increase in the total production of cycles from 2005 to 2009 was :
(a) 24.08%
(b) 23.12%
(c) 22.64%
(d) 24.02%
(e) None of these
3. In 2006, 15% of
the rural population and 8% of the urban population used cycles as their mode of
transportation. If the total population
in 2006 is 1.1 billion, then what is the rural population in million ? (Assume that one cycle is used by a single
person.)
the rural population and 8% of the urban population used cycles as their mode of
transportation. If the total population
in 2006 is 1.1 billion, then what is the rural population in million ? (Assume that one cycle is used by a single
person.)
(a) 600
(b) 0.6
(c) 500
(d) 0.5
(e) None of these
4. If the ratio of
the average cost to the customer of each cycle of the companies X,Y and Z is 2
: 4 : 3, then what is the percentage
increase in the total revenue of the cycles produced in the years 2007 to 2009. (Assume that the cost of the cycle
remained the same.)
the average cost to the customer of each cycle of the companies X,Y and Z is 2
: 4 : 3, then what is the percentage
increase in the total revenue of the cycles produced in the years 2007 to 2009. (Assume that the cost of the cycle
remained the same.)
(a) 39.89%
(b) 40.53%
(c) 42.64%
(d) 41.27%
(e) None of these
5. Over the five-year
period, the percentage increase in production was maximum for:
period, the percentage increase in production was maximum for:
(a) X
(b) Y
(c) Z
(d) Cannot be determined
(e) None of these
Regards
Team ExamPundit
Sponsored
(adsbygoogle = window.adsbygoogle || []).push({});
Books For 2015 Banking/Insurance Exams