Hello and welcome to ExamPundit. Here is a Data Interpretation Quiz for banking exams 2015.
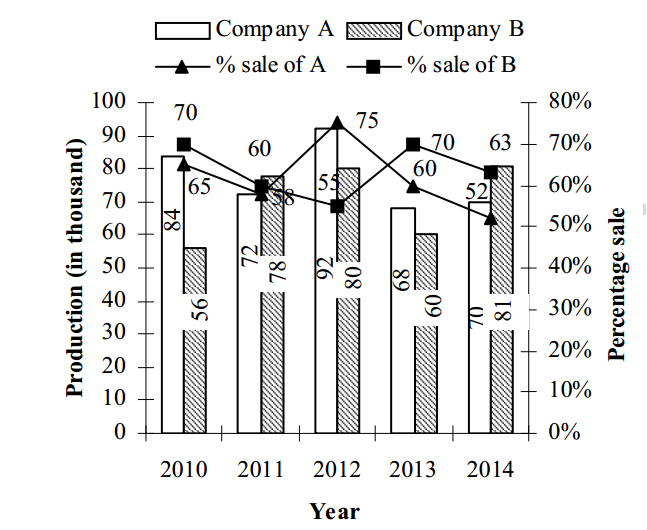
Note: Company A, 2014 Production : 70.
The following bar chart shows the production of motorcycles
by two companies A and B from 2010 to 2014 and the line graph shows the
percentage sale of these companies in the respective years.
by two companies A and B from 2010 to 2014 and the line graph shows the
percentage sale of these companies in the respective years.
Study the graph
carefully and answer the following.
carefully and answer the following.
1. What is the total
number of motorcycles sold by Company A and Company B together in 2010?
number of motorcycles sold by Company A and Company B together in 2010?
(a) 91200
(b) 92700
(c) 93800
(d) 94500
(e) 95600
2. What is the ratio
of the total number of motorcycles sold by Company B in 2011 to that sold by
Company A in 2013?
of the total number of motorcycles sold by Company B in 2011 to that sold by
Company A in 2013?
(a) 27 : 23
(b) 31 : 29
(c) 37 : 33
(d) 39 : 34
(e) None of these
3. The total no. of motorcycles
sold by Company A in 2014 is approximately what per cent of that produced by Company B in that year?
sold by Company A in 2014 is approximately what per cent of that produced by Company B in that year?
(a) 36%
(b) 45%
(c) 54%
(d) 62%
(e) None of these
4. What is the average
number of motorcycles sold by Company B in the given five years?
number of motorcycles sold by Company B in the given five years?
(a) 39645
(b) 41315
(c) 42408
(d) 43255
(e) 44606
5. What is the
approximate percentage rise/fall in the sale of Company A from 2011 to 2012?
approximate percentage rise/fall in the sale of Company A from 2011 to 2012?
(a) 63.5%
(b) 65%
(c) 67.8%
(d) 69.4%
(e) None of these
Note: Company A, 2014 Production : 70.
Regards
Team ExamPundit
Sponsored
(adsbygoogle = window.adsbygoogle || []).push({});
Books For 2015 Banking/Insurance Exams
This post was last modified on June 2, 2019 12:12 pm