Hello and welcome to ExamPundit. We are resetting the standards and raising them. This is just a beginning, higher and tougher ones will be given to raise your study level. All the best.
These questions are
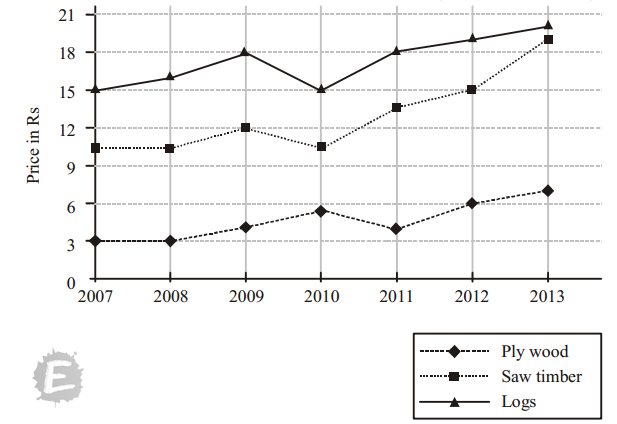
based on the information and chart given below. In the following chart, the
price of logs shown is per cubic meter and that of plywood and saw timber is
per ton. Given that 1 cubic meter of Plywood and Saw Timber = 800 kg. (1 ton =
1000 kg )
based on the information and chart given below. In the following chart, the
price of logs shown is per cubic meter and that of plywood and saw timber is
per ton. Given that 1 cubic meter of Plywood and Saw Timber = 800 kg. (1 ton =
1000 kg )
1. What is the
maximum percentage increase in price per cubic meter or per tonne over the previous
year?
maximum percentage increase in price per cubic meter or per tonne over the previous
year?
(a) 33.33%
(b) 85%
(c) 50%
(d) Cannot be determined
(e) None of these
2. Which product
shows maximum percentage increase in price over the period?
shows maximum percentage increase in price over the period?
(a) Saw Timber
(b) Plywood
(c) Logs
(d) Cannot be determined
(e) None of these
3. If 1 cubic meter =
750 kg for saw timber, find in which year was the difference in prices of logs
and saw timber the least?
750 kg for saw timber, find in which year was the difference in prices of logs
and saw timber the least?
(a) 2009
(b) 2010
(c) 2011
(d) 2012
(e) None of these
4. If 1 cubic meter =
700 kg for Plywood and 800 kg for Saw timbre find in which year was the
difference in prices of plywood and
saw timber the least?
700 kg for Plywood and 800 kg for Saw timbre find in which year was the
difference in prices of plywood and
saw timber the least?
(a) 2009
(b) 2010
(c) 2011
(d) 2012
(e) None of these
5. If in 2014 prices
increased by 5%, 1% and 10% while the volume of sales breakup was 40%, 30% and
30% for plywood, Saw Timber and Logs
respectively then what was the average realisation per cubic meter of sales?
increased by 5%, 1% and 10% while the volume of sales breakup was 40%, 30% and
30% for plywood, Saw Timber and Logs
respectively then what was the average realisation per cubic meter of sales?
(a) 18.95
(b) 16.45
(c) 13.15
(d) 10.25
(e) None of these
:: Download The Solution PDF ::
This will be the similar format of Upcoming Students League.
Regards
Team ExamPundit
Sponsored
(adsbygoogle = window.adsbygoogle || []).push({});
Books For 2015 Banking/Insurance Exams
This post was last modified on July 20, 2019 10:24 am