


Hello and welcome to exampundit. Here is a set of Data Interpretation Quiz for upcoming SBI PO Prelims 2017.

ep
SBI PO 2017: All India Tests in New Pattern
BOB Manipal 2017 – All India Free Mock Test
NIACL Assistant Mains 2017 – All India Free Mock Test
Dena Bank PGDBF 2017 – All India Free Mock Test
IBPS 2017 Exam Preparation & Tests
SSC CGL 2017: All India Test Series
NICL AO 2017 – All India Mock Test
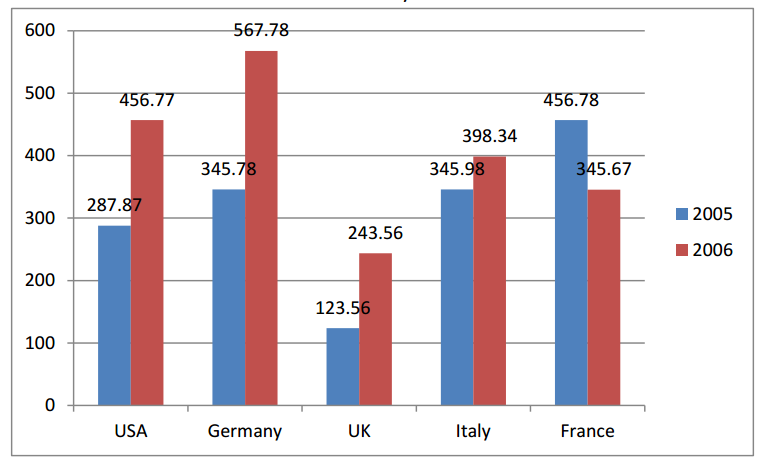
[Directions: Set of 5 Questions] The bar
graph shows the export of silk goods(in crore rupees) by different countries in
the years 2005 and 2006:
graph shows the export of silk goods(in crore rupees) by different countries in
the years 2005 and 2006:
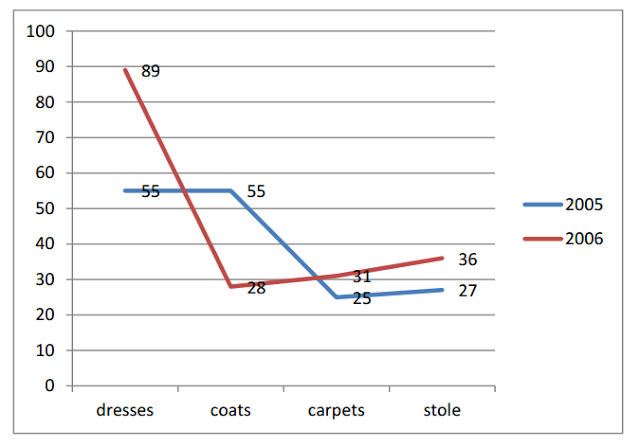
The line graph shows the breakup of cost of
different silk goods in percentage exported by France
different silk goods in percentage exported by France

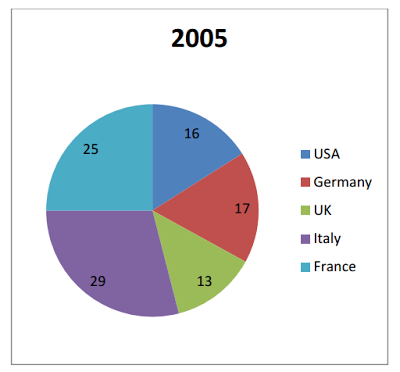
The pie chart shows the percentage of tax
paid per crore on exports by different countries in 2005
paid per crore on exports by different countries in 2005

1. The total cost of dresses exported by
France in 2005 is how many times of the carpets exported by France in 2006?
France in 2005 is how many times of the carpets exported by France in 2006?
A) 1.34
B) 0.34
C) 2.34
D) 3.34
E) 5.34
2. The average of silk exports in 2005 is
what percent of the average export in 2006?
what percent of the average export in 2006?
A) 87.53
B) 77.53
C) 56.36
D) 98.36
E) None
3. Who pays the maximum tax?
A) USA
B) Germany
C) Italy
D) UK
E) France
4. The tax paid by Germany is how much
percent less than the cost of silk stoles exported by France in 2005.
percent less than the cost of silk stoles exported by France in 2005.
A) 42.33
B) 52.33
C) 65.25
D) 78.36
E) None
5. The average of the exports of silk in
2006 by the 5 countries is :
2006 by the 5 countries is :
A) 402.42
B) 523.36
C) 502.36
D) 325.25
E) None
Advertisement
(adsbygoogle = window.adsbygoogle || []).push({});
Answers & Explanations:
1. Ans-c
0.55*456.78/ 0.31*345.67
=251.229/107.16=2.34
=251.229/107.16=2.34
2. Ans-b
2005 average=311.99
2006 average=402.42
Ans-311.99/402.42*100=77.53
3. Ans-E
USA=0.16*287.87=46.05
Germany=0.17*345.78=58.78
Italy=0.29*345.98=100.33
UK=0.13*123.56=16.06
France=0.25*456.78=114.195
4. Ans-b
Germany=0.17*345.78=58.78
silk stoles exported by France in
2005.=0.27*456.78=123.33
2005.=0.27*456.78=123.33
123.33-58.78/123.33*100=52.33%
5. Ans-A
ep
Recommended Test Series
Sponsored
(adsbygoogle = window.adsbygoogle || []).push({});
Regards
Team ExamPundit