


Hello and welcome to exampundit. Here is a set of Data Interpretation Quiz for NIACL Assistant Mains 2017.
ep
SBI PO 2017: All India Tests in New Pattern
RBI Grade B: Phase 1 & 2 Tests
BOB Manipal 2017 – All India Free Mock Test
NIACL Assistant Mains 2017 – All India Free Mock Test
Dena Bank PGDBF 2017 – All India Free Mock Test
IBPS 2017 Exam Preparation & Tests
SSC CGL 2017: All India Test Series
NICL AO 2017 – All India Mock Test
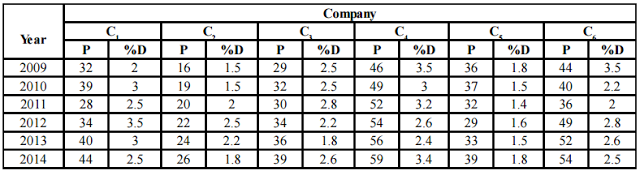
Directions (Q. 1-5): Study the graph carefully and answer the
questions given below.
questions given below.
Details of bulbs produced by
different companies over the years.
different companies over the years.
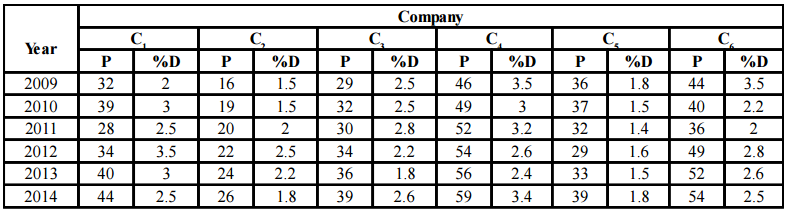
P = Number of bulbs produced in
lakhs
lakhs
% D = Percentage of defective
bulb
bulb
1. What was the overall
percentage of defective bulb produced by company C5 in 2009 and 2013 together?
(Rounded off to two digits after decimals).
percentage of defective bulb produced by company C5 in 2009 and 2013 together?
(Rounded off to two digits after decimals).
1) 0.81%
2) 0.67%
3) 1%
4) 1.66%
5) 1.95%
2. Which company had the
consistent increase in production over all the years?
consistent increase in production over all the years?
1) C1 and C2
2) C4 and C5
3) C2 and C4
4) C2 and C5
5) C4 and C3
3. What is the ratio of the average
production of company C3 to that C4 for all the given years together?
production of company C3 to that C4 for all the given years together?
1) 50 : 77
2) 50 : 79
3) 53 : 79
4) 51 : 79
5) 50 : 73
4. What was the number of defective
bulbs produced by company C1 and C2 together in the year 2011 and 2012
together?
bulbs produced by company C1 and C2 together in the year 2011 and 2012
together?
1) 284000
2) 274000
3) 284500
4) 279000
5) 284800
5. What was the approximate
increase/decrease in total production by all companies together from 2012 to
2013?
increase/decrease in total production by all companies together from 2012 to
2013?
1) 8.5% decrease
2) 6.5% decrease
3) 7.5% increase
4) 4.5% decrease
5) 8.5% increase
Directions (Q. 6-10): In each of the following number series,
only one number is wrong. Find out the wrong number.
only one number is wrong. Find out the wrong number.
6. 5 8 17 40 134 471.5 1889
1) 8
2) 17
3) 40
4) 134
5) 1889
7. 17 17 18 25 53 117 242
1) 17
2) 18
3) 25
4) 117
5) 242
8. 7 63 439 2205 6615 6615
1) 7
2) 439
3) 2205
4) 6615
5) None of these
9. 10 11 26 90 364 1845
1) 26
2) 90
3) 364
4) 1845
5) 11
10. 218 219 211 220 150 181 -35
1) 219
2) 220
3) 150
4) -35
5) 181
|
exampundit Recommends
All India Free Mock Test for NIACL Assistant Mains 2017
Click here to Take Free Mock
|
ep
Recommended Test Series
Sponsored
(adsbygoogle = window.adsbygoogle || []).push({});
Regards
Team ExamPundit