


Hello and welcome to Exampundit. Here is a set of Data Interpretation Quiz for upcoming Bank and Insurance Examination.
Following line graph shows the per cent profit gained by two companies A and B. The table shows the expenditure in ₹ lakh) of company A and income (in ₹ lakh) of company B.
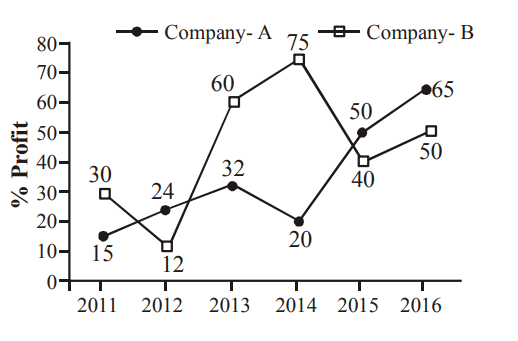
| Year | Expenditure-A (in ₹ lakh) | Income B (in ₹ lakh) |
| 2011 | 62.4 | 57.2 |
| 2012 | 75 | 67.2 |
| 2013 | 40 | 58.4 |
| 2014 | 80.5 | 71.4 |
| 2015 | 72.8 | 63 |
| 2016 | 64 | 84.6 |
- What is the total income (in ₹ ) of company ‘A’ in all six years together?
(a) 472.8 lakh
(b) 528.96 lakh
(c) 551.12 lakh
(d) 566.84 lakh
(e) None of these
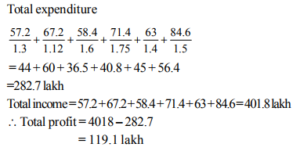
- What is the total profit (in ₹ ) of company ‘B’ in all six years together?
(a) 111.4 lakh
(b) 113.6 lakh
(c) 116.8 lakh
(d) 18.4 lakh
(e) 119.1 lakh
Option: E
Explanation:
- What is the ratio of the expenditure of ‘A’ in 2011 to the income of ‘B’ in 2012 ?
(a) 7 : 8
(b) 11 : 13
(c) 13 : 14
(d) 15 : 17
(e) None of these
Option: C
Explanation:
![]()
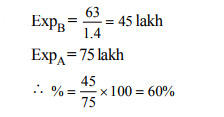
- Expenditure of ‘B’ in 2015 is what % of expenditure of ‘A’ in 2012 ?
(a) 60%
(b) 75%
(c) 80%
(d) 90%
(e) 120%
Option: A
Explanation:
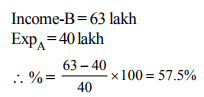
- Income of company ‘B’ in 2015 is what % more than the expenditure of ‘A’ in 2013 ?
(a) 42.5%
(b) 47.5%
(c) 57.5%
(d) 62.5%
(e) 67.5%
Option: C
Explanation:
DIRECTIONS (Qs. 6-10): Read the information carefully and answer the questions below to it.
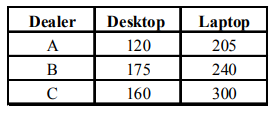
Three dealers ‘A’, ‘B’ and ‘C sold a total number of 1200 computer systems (both laptop and desktop) in a month. The number of desktops sold by Dealer ‘A’ is 10% of the total number of systems sold by all three dealers and the total number of systems sold by Dealer ‘B’ is 415, which is 210 more than the number of laptops sold by Dealer ‘A’. The number of laptops sold by Dealer ‘B’ is 200% of the number of desktops sold by Dealer ‘A’ number of laptops sold by Dealer-C is 125% of the number of laptops sold by Dealer-B.
- What is the total number of desktops sold by Dealer C?
(a) 120
(b) 140
(c) 160
(d) 175
(e) 180
Option: C
Explanation:
- What is the total number of laptops sold by all three dealers?
(a) 645
(b) 725
(c) 730
(d) 745
(e) 750
Option: D
Explanation:
- The number of desktops sold by Dealer A is what percentage of the number of laptops sold by Dealer C?
(a) 40%
(b) 50%
(c) 60%
(d) 70%
(e) 80%
Option: A
Explanation:
- What is the ratio of the number of desktops sold by Dealer B to the number of laptops sold by Dealer C?
(a) 4:7
(b) 5:9
(c) 5:11
(d) 7:12
(e) 8:15
Option: D
Explanation:
- What is the difference between the number of desktops sold by Dealer ‘B’ and ‘C’ together and the number of total computer systems (both desktop and laptop) sold by Dealer A?
(a) 50
(b) 40
(c) 30
(d) 20
(e) 10
Option: E
Explanation:
Regards
Team EP