


Hello and welcome to ExamPundit. Here is a set of Data Interpretation Quiz for Bank and Insurance Exams in 2016.
Directions (Q. 1 – 6): Study the
following graph carefully to answer the given questions.
following graph carefully to answer the given questions.
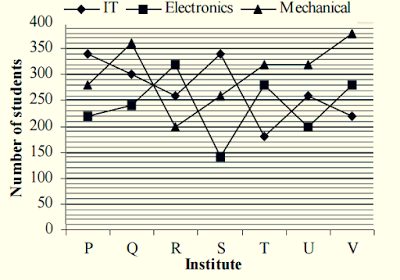
Strength of seven technology
institutes with specialisation in IT, Electronics and Mechanical in 2012
institutes with specialisation in IT, Electronics and Mechanical in 2012
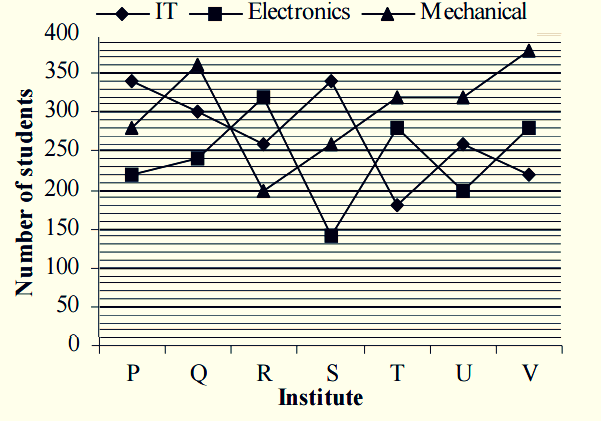
1. If the no. of students with
Mechanical specialisation in each institute increased by 20% and the no. of
students with Electronics specialisation in each institute decreased by 15%
from 2012 to 2013, the total no. of students with Mechanical from all the
institutes in 2013 is approximately what per cent of the total no. of students
with Electronics specialisation from all the institutes in 2013?
1) 122
2) 116
3) 162
4) 132
5) 178
2. What is the ratio of the total
no. of students in institute R to that in V?
no. of students in institute R to that in V?
1) 39 : 43
2) 39 : 44
3) 37 : 44
4) 39 : 45
5) 38 : 43
3. What is the difference between
the total no. of students with IT specialisation from all the institutes
together and the total no. of students with Mechanical specialisation from all
the institutes together?
the total no. of students with IT specialisation from all the institutes
together and the total no. of students with Mechanical specialisation from all
the institutes together?
1) 260
2) 240
3) 280
4) 220
5) 250
4. If the no. of students in
institutes P, Q and R with IT specialisation increased by 15%, 22% and 10%
respectively from 2012 to 2013, what was the total no. of students with IT
specialisation in the three institutes together in 2013?
institutes P, Q and R with IT specialisation increased by 15%, 22% and 10%
respectively from 2012 to 2013, what was the total no. of students with IT
specialisation in the three institutes together in 2013?
1) 1028
2) 1056
3) 1043
4) 1142
5) 1145
5. If out of the total no. of
students for all three specialisations together in Institute Q, the no. of
students having liking for Music, Painting and Cricket are in the ratio of 5 :
6 : 7, then what is the no. of students having liking for Music from this
institute?
students for all three specialisations together in Institute Q, the no. of
students having liking for Music, Painting and Cricket are in the ratio of 5 :
6 : 7, then what is the no. of students having liking for Music from this
institute?
1) 250
2) 300
3) 350
4) 360
5) 280
6. In institutes P, T and U the
percentage of girls out of total no. of students with Electronics
specialisation in the respective institutes is 50%, 55% and 48% respectively,
what is the total no. boys in these three institutes with Electronics
specialisation?
percentage of girls out of total no. of students with Electronics
specialisation in the respective institutes is 50%, 55% and 48% respectively,
what is the total no. boys in these three institutes with Electronics
specialisation?
1) 340
2) 386
3) 356
4) 360
5) 314
Directions (Q. 7 – 11): Study the
following graph carefully to answer the given questions.
following graph carefully to answer the given questions.
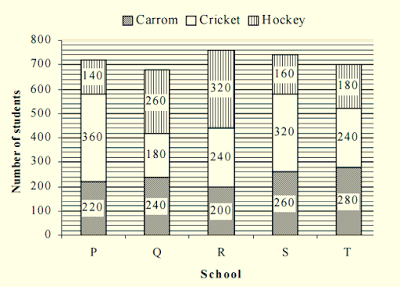
Number of students playing
Carrom, Cricket and Hockey from different schools
Carrom, Cricket and Hockey from different schools

7. The total number of students
playing Carrom and Hockey together from school P is what per cent of the total
no. of students playing these two games together from school R?
playing Carrom and Hockey together from school P is what per cent of the total
no. of students playing these two games together from school R?
1) 68 3/16
2) 62 3/13
3) 69 3/13
4) 63 3/13
5) 62 3/16
8. If the no. of students playing
each game in school S is increased by 15% and the no. of students playing each
game in school Q is decreased by 5%, what will be the difference between the
no. of students in school S and Q?
each game in school S is increased by 15% and the no. of students playing each
game in school Q is decreased by 5%, what will be the difference between the
no. of students in school S and Q?
1) 54
2) 218
3) 356
4) 224
5) 205
9. If out of the students playing
Cricket from schools Q, S and T, 40%, 35% and 45% respectively got selected for
State level competition, what is the total no. of students who got selected for
State level competition from these three schools together?
Cricket from schools Q, S and T, 40%, 35% and 45% respectively got selected for
State level competition, what is the total no. of students who got selected for
State level competition from these three schools together?
1) 346
2) 241
3) 292
4) 284
5) 268
10. The total number of students
playing Hockey from all schools together is approximately what per cent of the
total number of students playing Cricket from all schools together?
playing Hockey from all schools together is approximately what per cent of the
total number of students playing Cricket from all schools together?
1) 84
2) 74
3) 72
4) 79
5) 70
11. From school P, out of the
students playing Carrom, 40% got selected for State level competition, out of
which 25% further got selected for National level competition. From school T,
out of the students playing Carrom, 45% got selected for State level competition,
out of which two-thirds further got selected for National level competition.
What is the total no. of students playing Carrom from these two schools who got
selected for National level competition?
1) 106
2) 98
3) 112
4) 108
5) 96
:: Solutions ::
Winners
- Sur(*-*)
- Mujhe Kuch Nhi Aata
- Roger Federer
Regards
Team ExamPundit
Sponsored
(adsbygoogle = window.adsbygoogle || []).push({});